Customer retention metrics: separate users, accounts, and revenue
Separate user activity, account retention, and recurring revenue with worked examples. Calculate gross and net retention while keeping new-customer revenue out.
The ClickClacks team · 6 min read
On this page 8 sections
- Start with the decision and the unit
- Measure product retention from a starting cohort
- Calculate customer retention from the opening group
- Separate gross and net revenue retention
- Agree on the billing policy before comparing results
- Read the measures together without blending them
- Segment on a question you can answer
- Build a review that preserves the distinction
Customer retention metrics answer different questions depending on what you count. Product retention asks whether people or accounts return to a useful action. Customer retention asks whether existing customers remain customers. Revenue retention asks how recurring revenue from an existing customer group changes.
Keep those measures separate. A customer can keep paying while product usage falls. One person can leave a workspace while the rest of the team remains active. A few expanding accounts can increase revenue even as smaller customers cancel. A single percentage cannot describe all three situations.
This guide uses one fictional SaaS business to work through the distinctions. The counts and dollar amounts are illustrative and are not benchmarks or ClickClacks customer results.
Start with the decision and the unit
If you are reviewing whether users return after onboarding, start with distinct people and a meaningful return action. If you are deciding which customer accounts need attention, aggregate behavior at the account level. If you are reviewing renewals or recurring revenue, use billing records and a documented customer definition.
Do not treat a subscription record as automatically equivalent to a customer. One customer may have multiple subscriptions, and a workspace may not map one-to-one to a billing account. Build and validate that relationship before joining usage and revenue data.
Write the metric’s unit in its name or caption. “Week 2 task retention, people” is much clearer than “retention.” An account-based analysis is useful precisely because a shared customer outcome can involve several people rather than one consistently active individual.
Measure product retention from a starting cohort
Suppose 200 people first complete the app’s core task during an entry period. During the defined Week 2 interval, 80 of them complete the task again. Exact-interval person retention is 80 divided by 200, or 40%.
Now group those people into the 50 accounts they belong to. If 35 of those accounts have at least one qualifying person perform the return action in Week 2, account activity retention is 35 divided by 50, or 70%.
Both numbers can be correct. They use different units and definitions. Neither says whether the accounts are paying. Also consider whether “at least one active person” is sufficient for the account’s job: a collaboration product may need broader participation to deliver value.
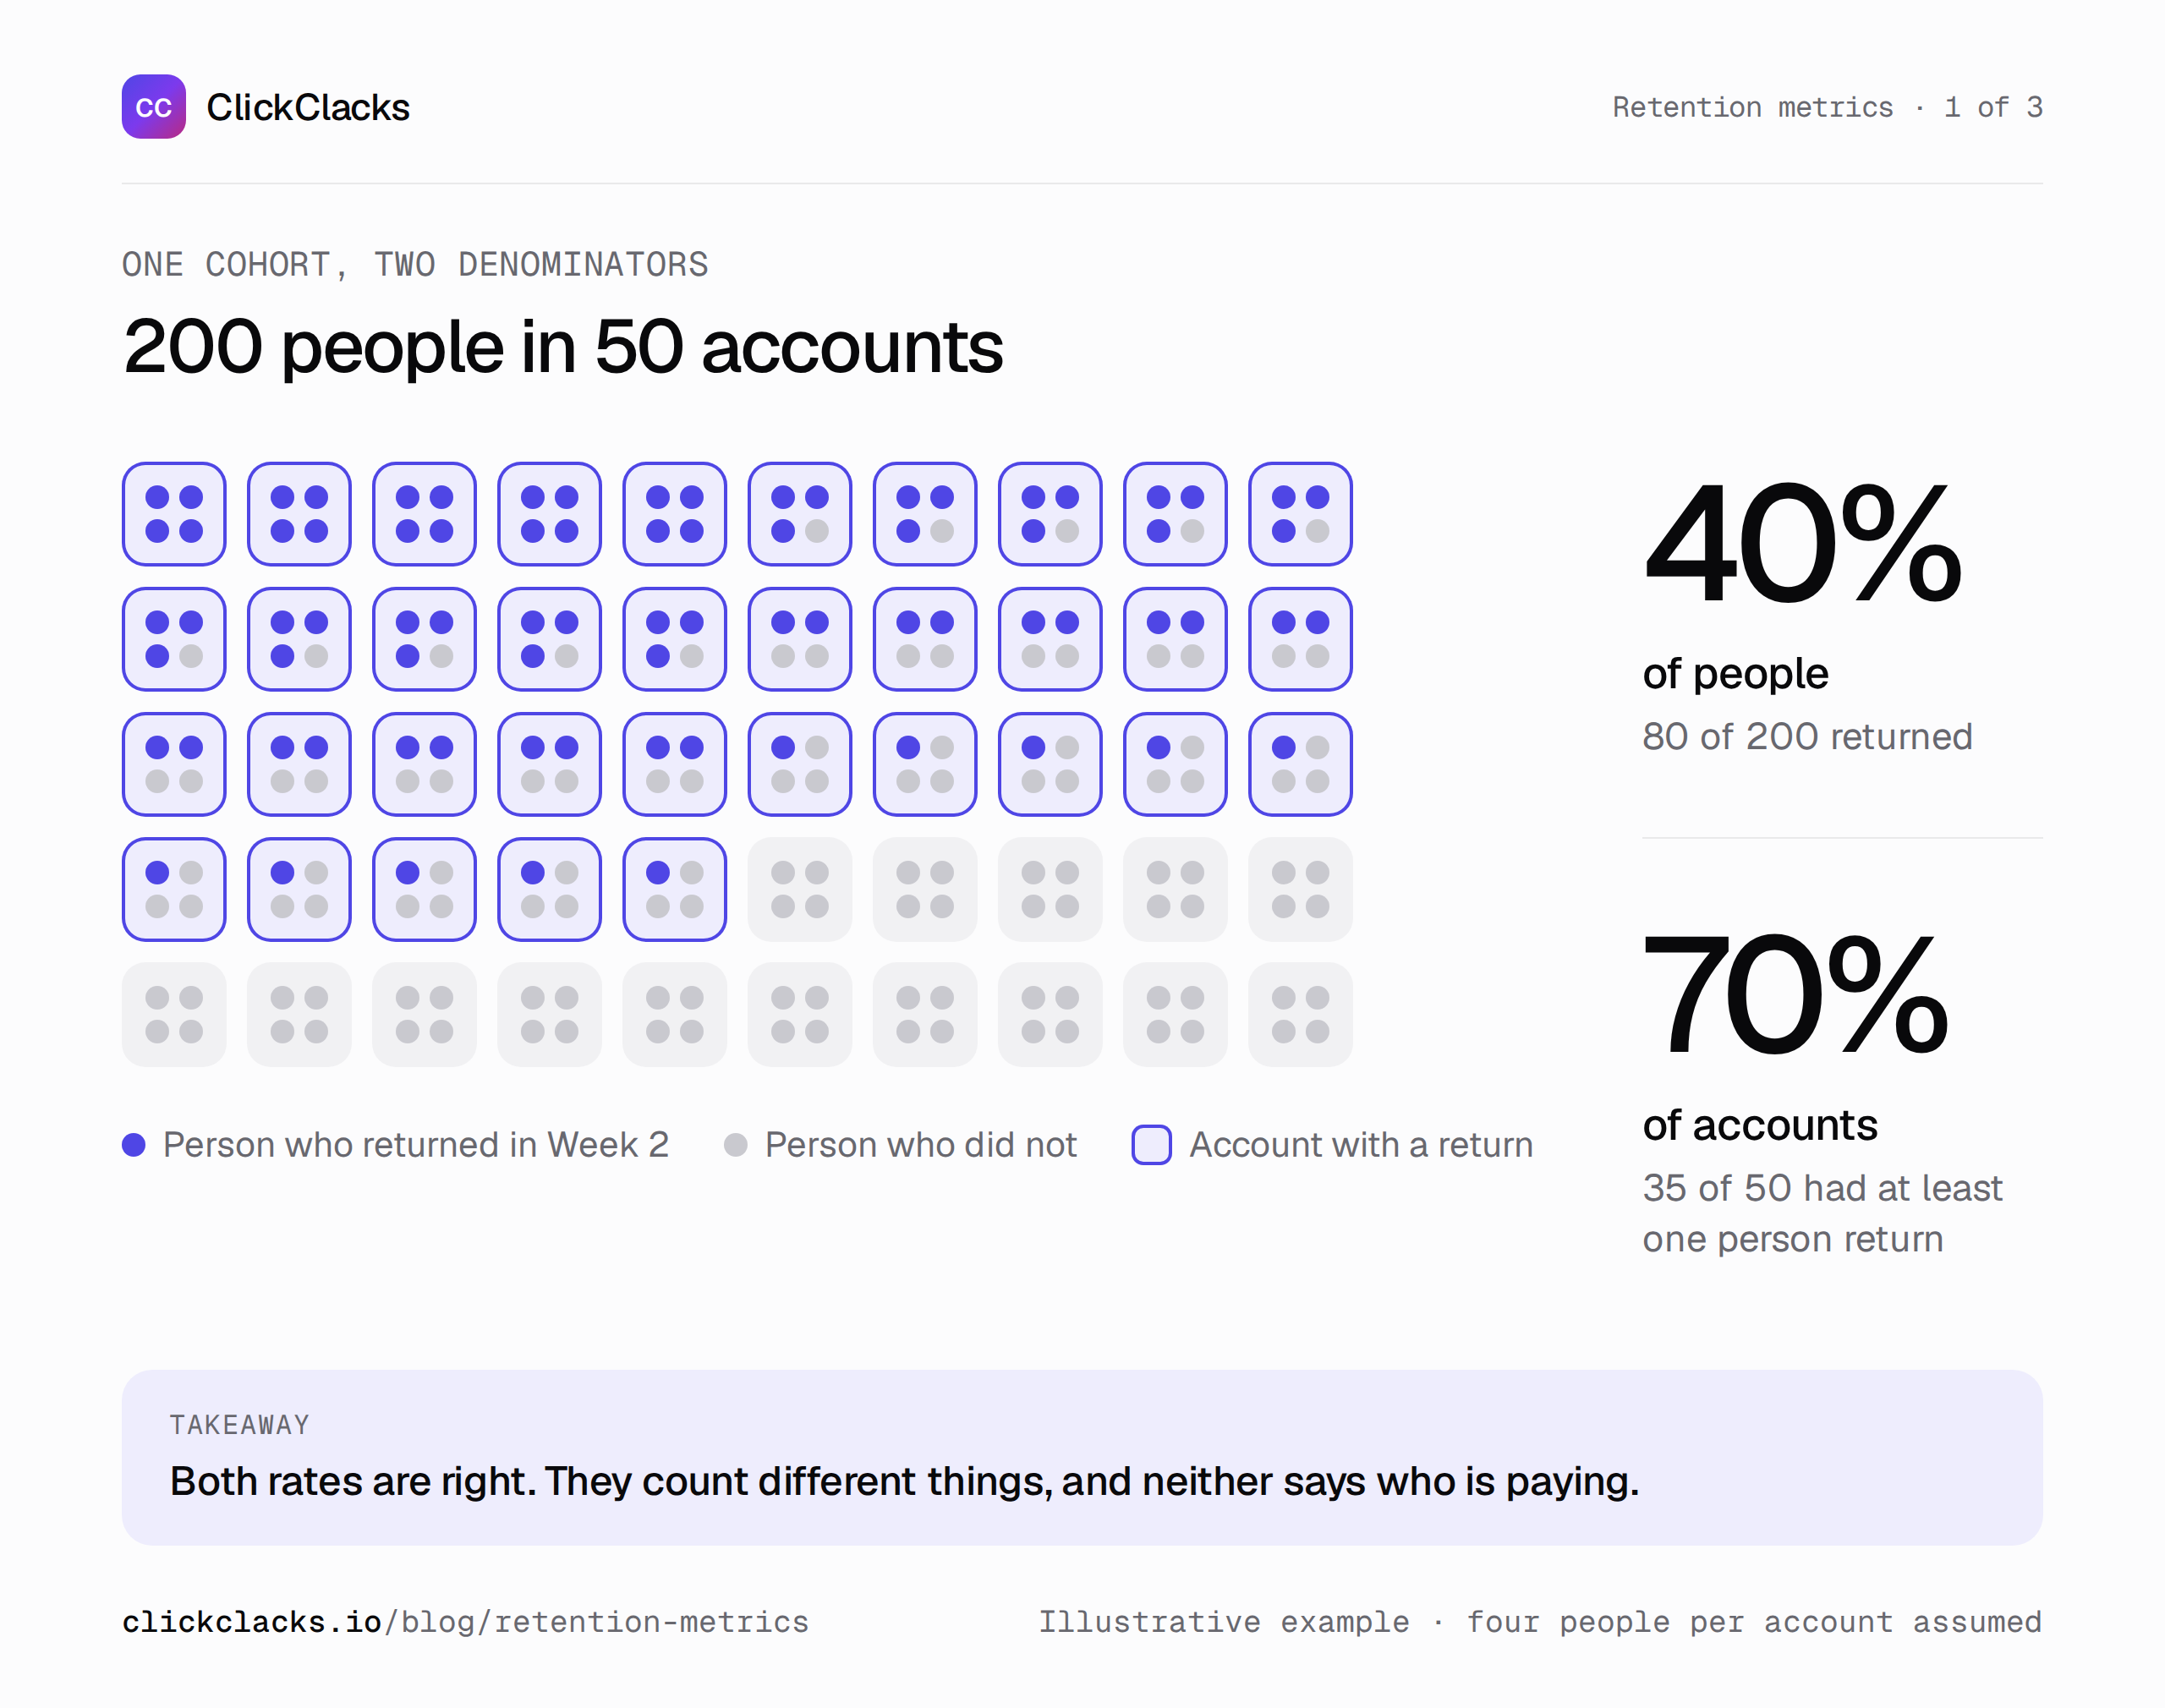
Person retention is 40%; account activity retention is 70%. These are separate denominators.
Calculate customer retention from the opening group
For a billing example, begin a month with 50 paying customer accounts. Five cancel during the month, and none of those five reactivate before month end. The remaining 45 are retained from the starting group, so customer retention is 45 divided by 50, or 90%.
Suppose ten new customers also join. The business ends with 55 paying customers, but those ten do not belong in the retained numerator. Counting all 55 against the original 50 would combine acquisition with retention and report 110%, which is not the share of starting customers retained.
The equivalent formula is ending customers minus new customers, divided by starting customers, provided the definitions and movements reconcile. Following the opening customer IDs directly is often easier to audit, especially when reactivation, account merges, or multiple subscriptions complicate the arithmetic.
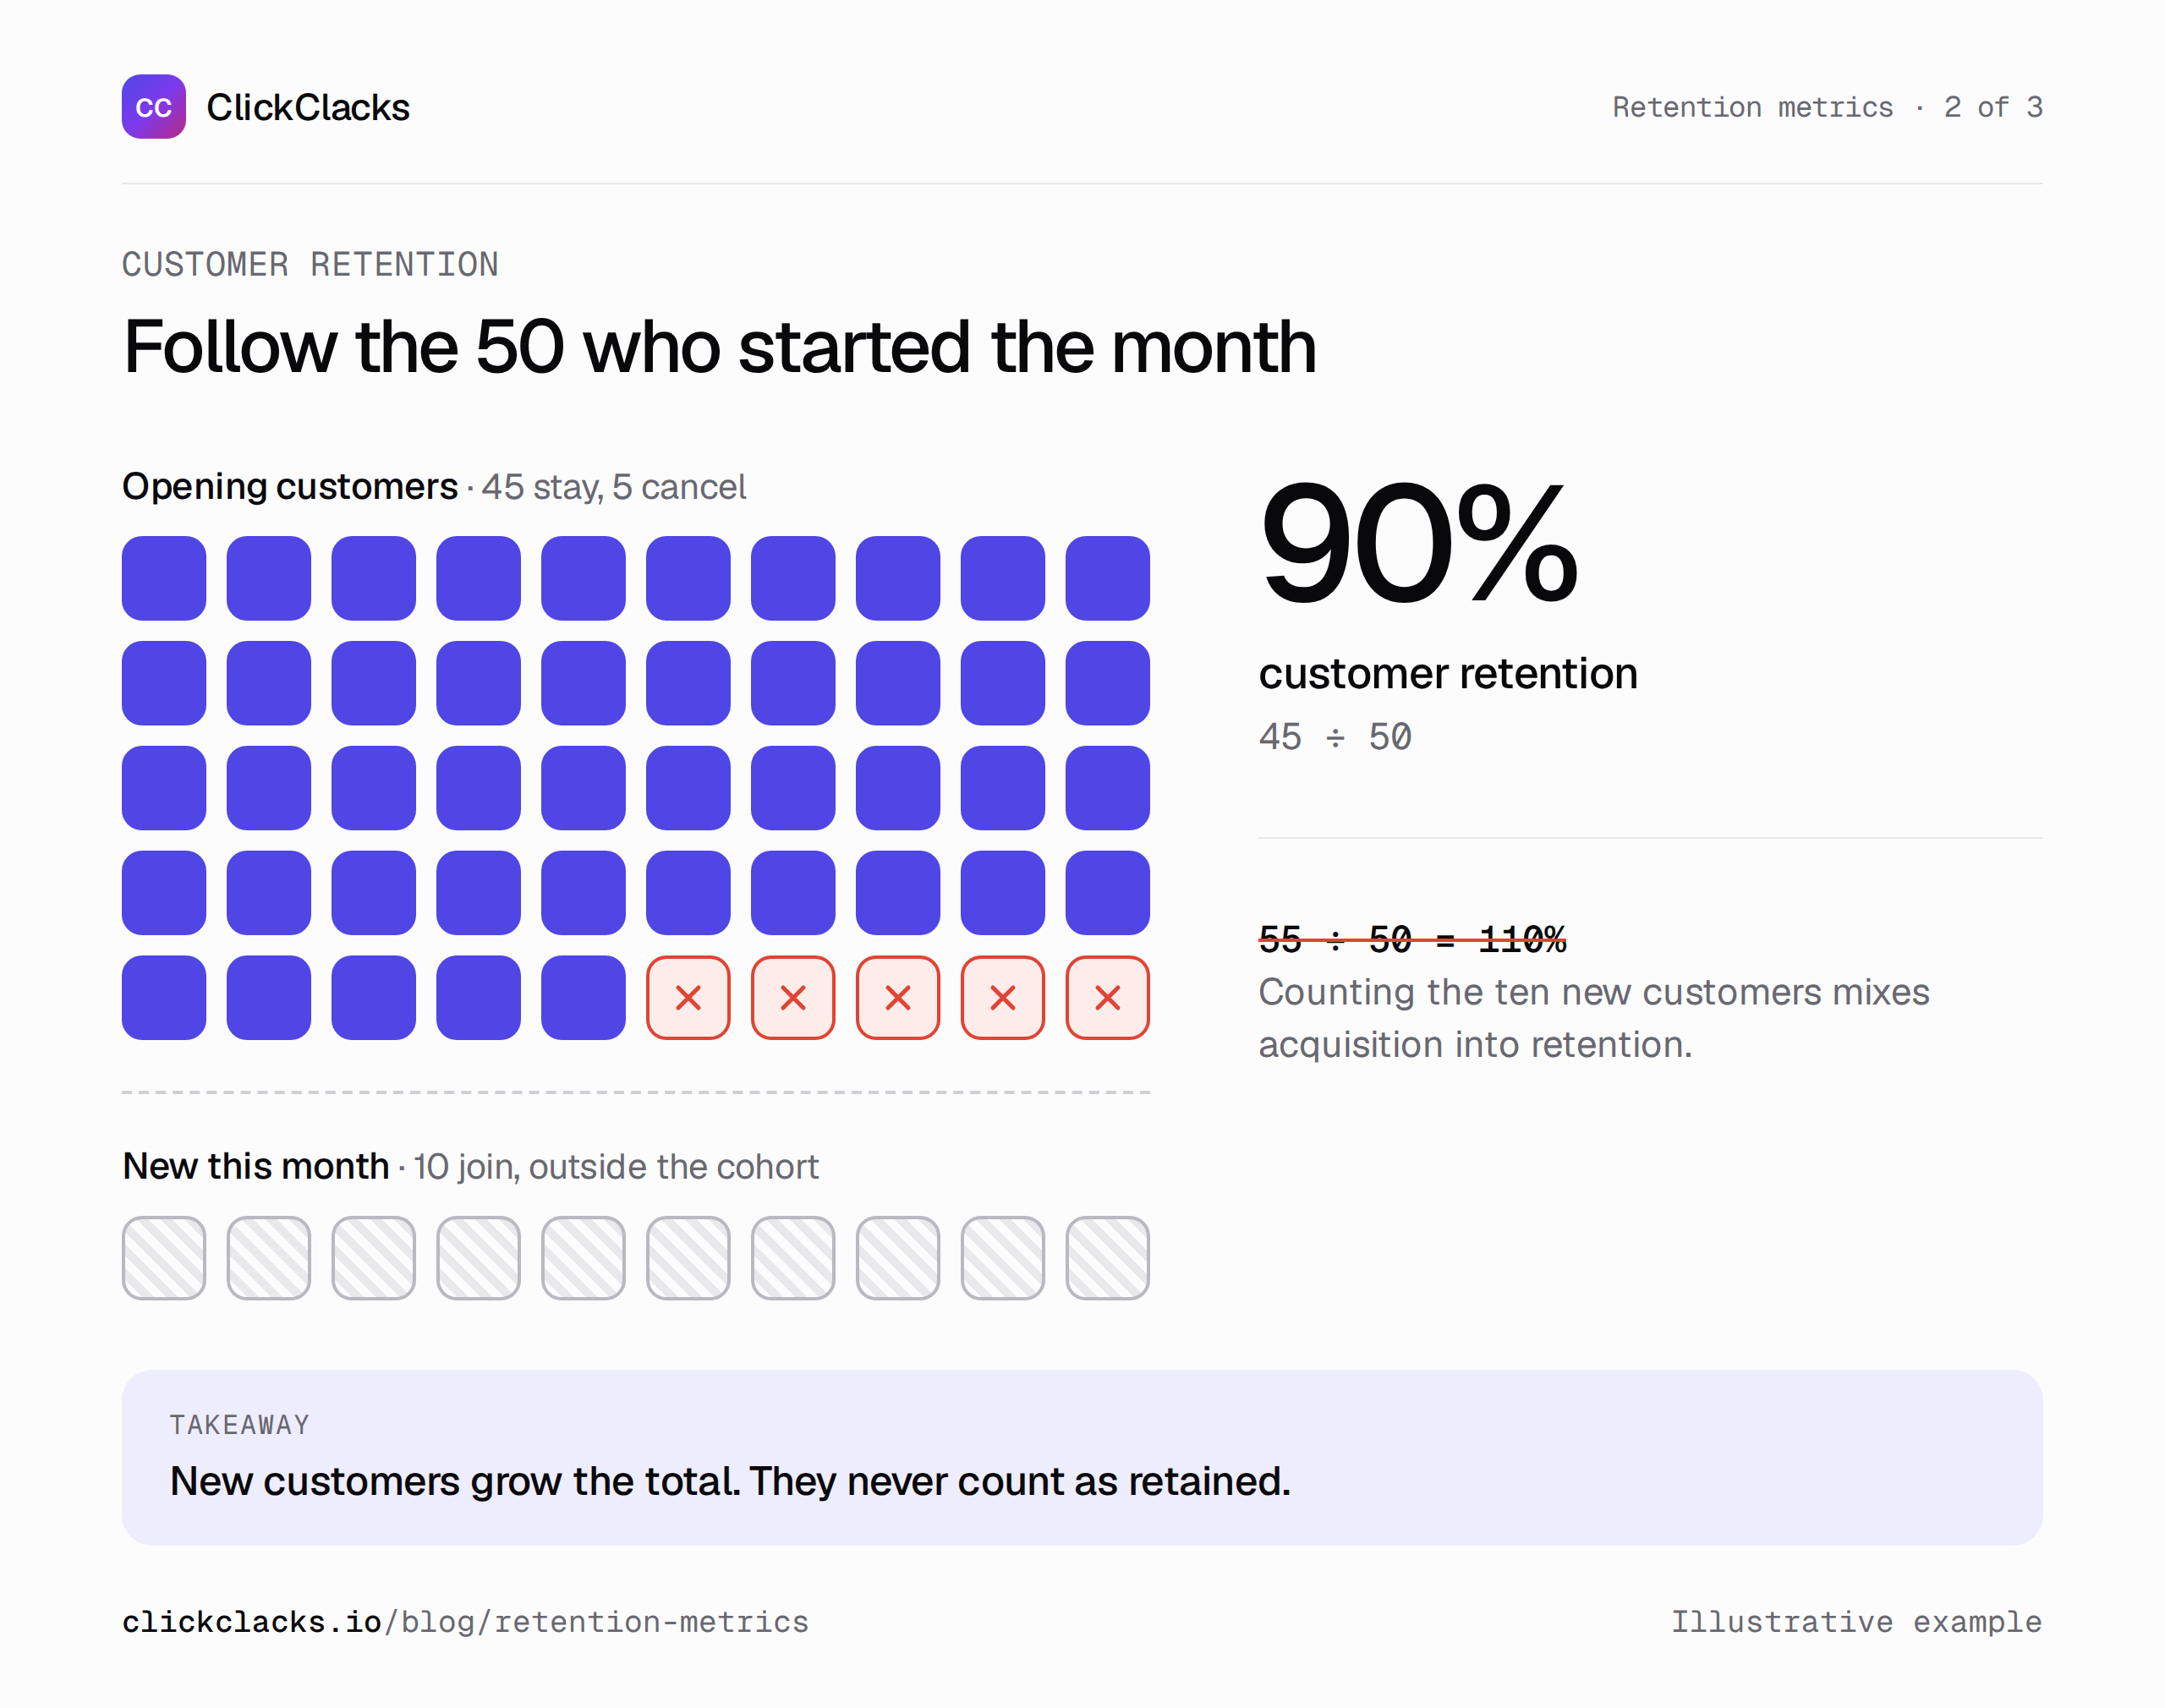
Illustrative customer cohort: the ten new customers increase the ending total but do not count as retained customers.
Separate gross and net revenue retention
Use the same opening customer cohort with $10,000 in monthly recurring revenue. During the month, cancellations remove $1,000, downgrades remove $500, and upgrades add $2,000. New customers contribute another $3,000, but that new revenue is outside the opening cohort.
Gross revenue retention ignores expansion: subtract the $1,000 of churn and $500 of contraction from $10,000, then divide by $10,000. The result is 85%. This shows how much of the opening recurring revenue remains before upgrades offset losses.
Net revenue retention includes expansion from the opening cohort. Add the $2,000 of upgrades to the $8,500 remaining base and divide by $10,000. The result is 105%. It can exceed 100% because retained customers can expand. The distinction between customer and revenue cohorts is reflected in this billing analytics reference.
The opening cohort ends at $10,500. Adding the $3,000 from new customers gives $13,500 total month-end recurring revenue. That last number is a revenue balance, not the numerator for net retention.
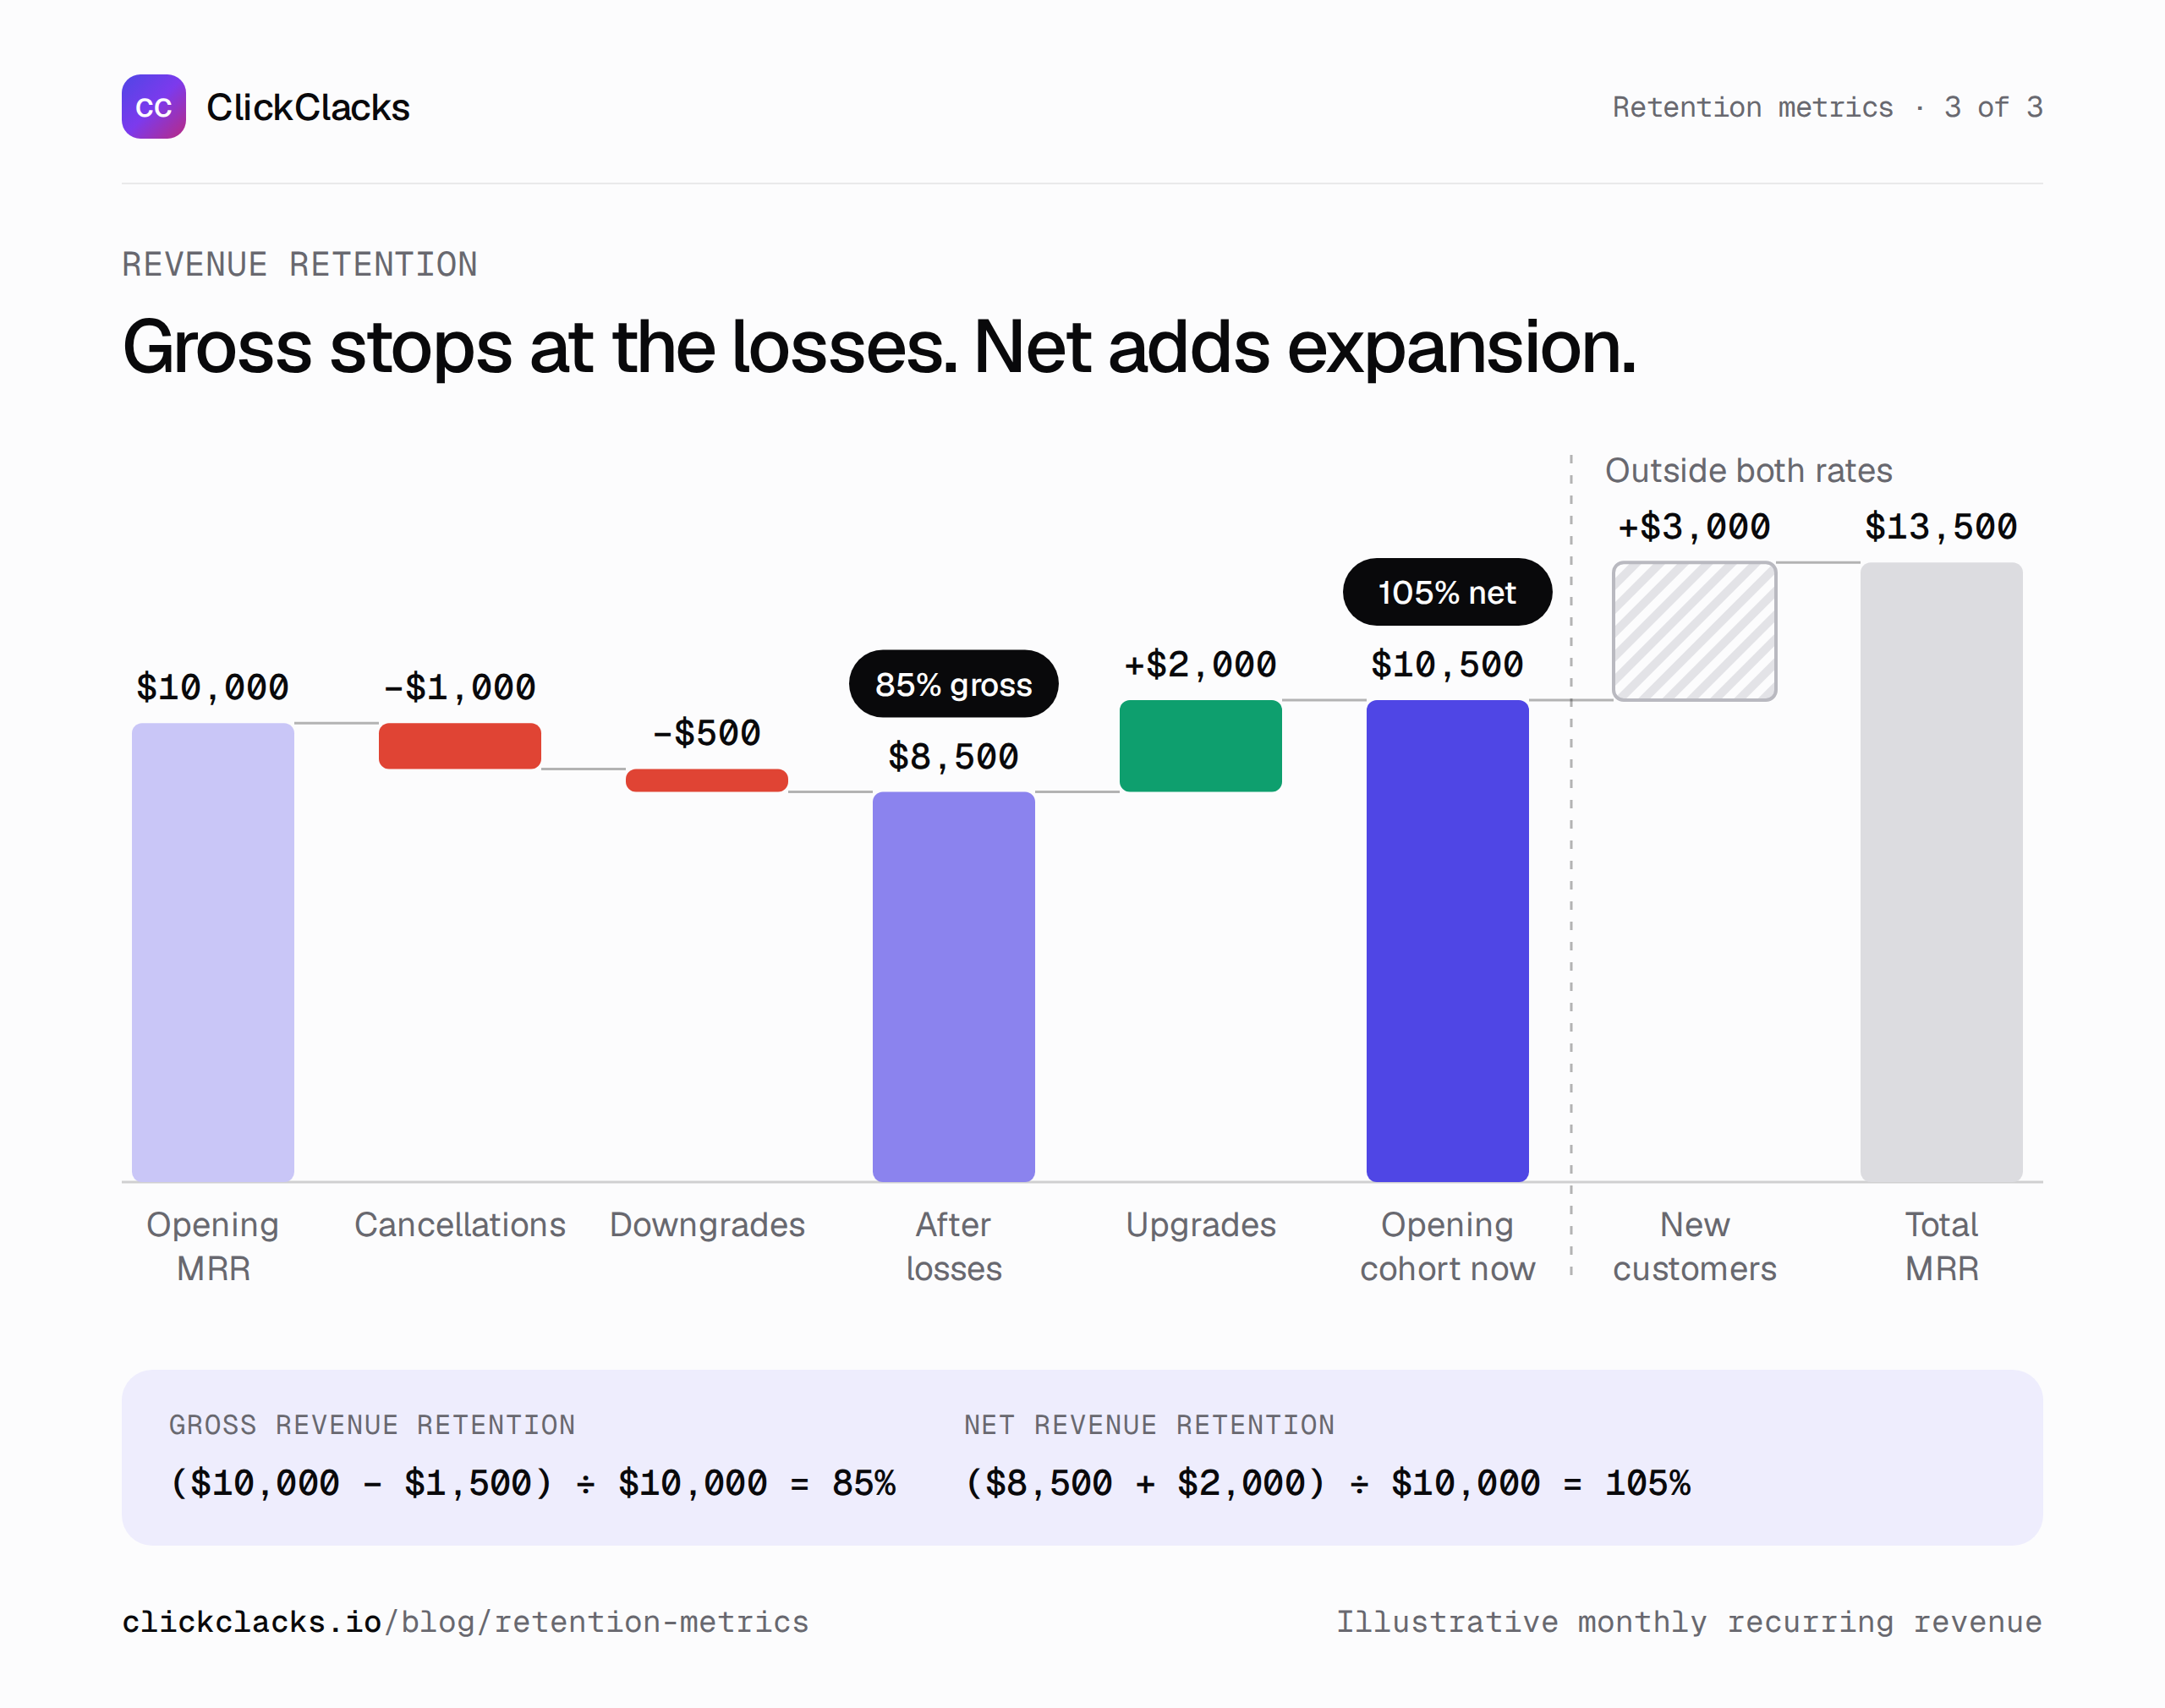
Illustrative monthly recurring revenue. New-customer revenue is excluded from both retention rates.
Agree on the billing policy before comparing results
Decide how you treat discounts, paused subscriptions, delinquent payments, credits, and currency changes. Monthly recurring revenue is a defined recurring run rate; it is not necessarily the same as cash collected in the month or recognized accounting revenue.
Reactivation deserves an explicit rule. A customer who cancels and returns can be classified differently depending on the reporting convention and cohort period. Preserve the underlying movement and state the policy so another reader can reconcile your result.
Use an authoritative billing dataset for financial measures. A product event named subscription_updated may help with context, but it does not automatically capture every billing adjustment correctly. Do not imply that a product-usage dashboard is a complete finance system.
Read the measures together without blending them
Imagine customer retention is 90% and net revenue retention is 105%, as in the example. Expansion has more than offset lost recurring revenue, but five starting customers still left. The business may be growing within larger accounts while losing a smaller segment.
If account activity also weakens, investigate whether apparently retained customers are receiving less value. That does not prove they will cancel. Some products have seasonal or infrequent jobs, and an annual contract can create a delay between reduced use and a billing change.
Likewise, healthy individual activity does not prove an account will renew. Active users may lack purchasing authority, or the product may be useful but not worth its price to the buyer. Use the metrics to identify questions for product and customer conversations.
Segment on a question you can answer
Account size, product use case, tenure, and acquisition period can reveal different patterns. Choose a segment because it could change an action, such as improving team onboarding for accounts with low participation. Avoid splitting the dataset until every segment is too small to interpret.
Show opening counts and revenue alongside rates. Losing one of three large customers and losing one of 300 small customers are different situations, even if a chart can make their percentages look equally precise. When combining segments, sum the relevant numerators and denominators rather than averaging percentages.
Keep cohort maturity consistent for product retention. An account that has not reached its Week 2 observation interval cannot yet have a final Week 2 result. Billing-period closure and product-cohort maturity are separate timing concerns.
Build a review that preserves the distinction
Use a compact set of measures: person return rate for the relevant task, account activity retention, customer retention, gross revenue retention, and net revenue retention. Not every team needs all five every week; choose a cadence that matches the decision and data freshness.
The retention page supports the behavioral side of this work, while the Companies page explains account-level analysis. Keep billing calculations in the system that owns them and join only through validated account identifiers when you need a combined review.
Finish the review with a question that names the affected group. “Why did five opening customers cancel while surviving accounts expanded?” is more useful than “Is retention good?” It preserves the difference between people returning, customers staying, and revenue growing.
Keep reading
All posts
Analytics6 min read
Time to value: measure the wait for a useful result
Define time to value, keep non-completers visible, and break the wait into actionable stages. Learn why a faster median can coexist with a worse completion rate.
Analytics6 min read
Activation rate: choose the milestone before the metric
Define a meaningful activation milestone, calculate a cohort rate, and handle incomplete observation windows with practical examples for a SaaS product team.
Analytics6 min read
Product engagement metrics for a weekly team review
Choose meaningful activity, frequency, and participation metrics for a focused weekly review. Use clear definitions, quality checks, and an accountable next action.