Product engagement metrics for a weekly team review
Choose meaningful activity, frequency, and participation metrics for a focused weekly review. Use clear definitions, quality checks, and an accountable next action.
The ClickClacks team · 6 min read
On this page 9 sections
- Decide what the meeting needs to produce
- Define meaningful active use
- Choose a frequency measure that fits the job
- Measure breadth when the product is collaborative
- Keep quality beside activity
- Use comparable periods and stable definitions
- Run the review in a consistent sequence
- Keep the dashboard small enough to explain
- End with an accountable next step
Product engagement metrics should tell your team whether people are using the product to do useful work, how often that happens, and where the experience needs investigation. For a weekly review, a small set with clear definitions is easier to act on than a page of unrelated totals.
Start with a meaningful activity definition. Then add a measure of frequency and, where relevant, breadth of participation. Keep one outcome or quality check nearby so more activity is not automatically treated as a better experience.
This guide builds an illustrative review for a fictional team-planning app. Its numbers are teaching examples. The proposed measures are a starting point to adapt, not a universal scorecard every SaaS company should copy.
Decide what the meeting needs to produce
A useful weekly review should end with one or two bounded investigations, an owner, and a date to return with evidence. It should not require every metric to move upward. Some product work reduces the number of steps or visits needed to finish a task.
Write the user goal first: “Teams coordinate and complete planned work.” Observable signals might include completed tasks, participation from multiple members, and successful recurring use. The goals, signals, and metrics framework provides a useful way to keep that connection explicit.
For each proposed metric, ask what decision could change if it moved. If the answer is only “we would feel pleased or worried,” the measure needs a clearer purpose or does not belong in the weekly review.
Define meaningful active use
For this example, call a person active during a UTC calendar week if they complete at least one non-test task. Login events, page views, and background refreshes do not qualify. They may be useful diagnostic signals, but they do not establish that the planning job was done.
Suppose 240 eligible people perform that action during the week, compared with 220 in the previous complete week. That is an increase of 20 people, or about 9.1%. It does not yet tell you whether existing users became more engaged or whether more new users arrived.
Keep counts split into useful lifecycle groups when needed: newly active, continuing, and returning after an absence. Define those groups so they do not overlap in the same week. That can explain a movement without collapsing very different behaviors into one rising line.
Choose a frequency measure that fits the job
For a product meant to support work throughout the week, count how many distinct days each active person completes a task. In our example, 150 of the 240 weekly active people complete tasks on at least two distinct days. The two-day share is therefore 62.5%.
This is a chosen operational definition, not a universal engagement standard. A monthly invoicing product should not inherit it simply because the calculation is convenient. Match the expected cadence to the job users need done.
The denominator also matters. A two-day share among weekly active people excludes everyone who was inactive all week. Keep the weekly active count beside it so the frequency percentage cannot hide a shrinking active population.
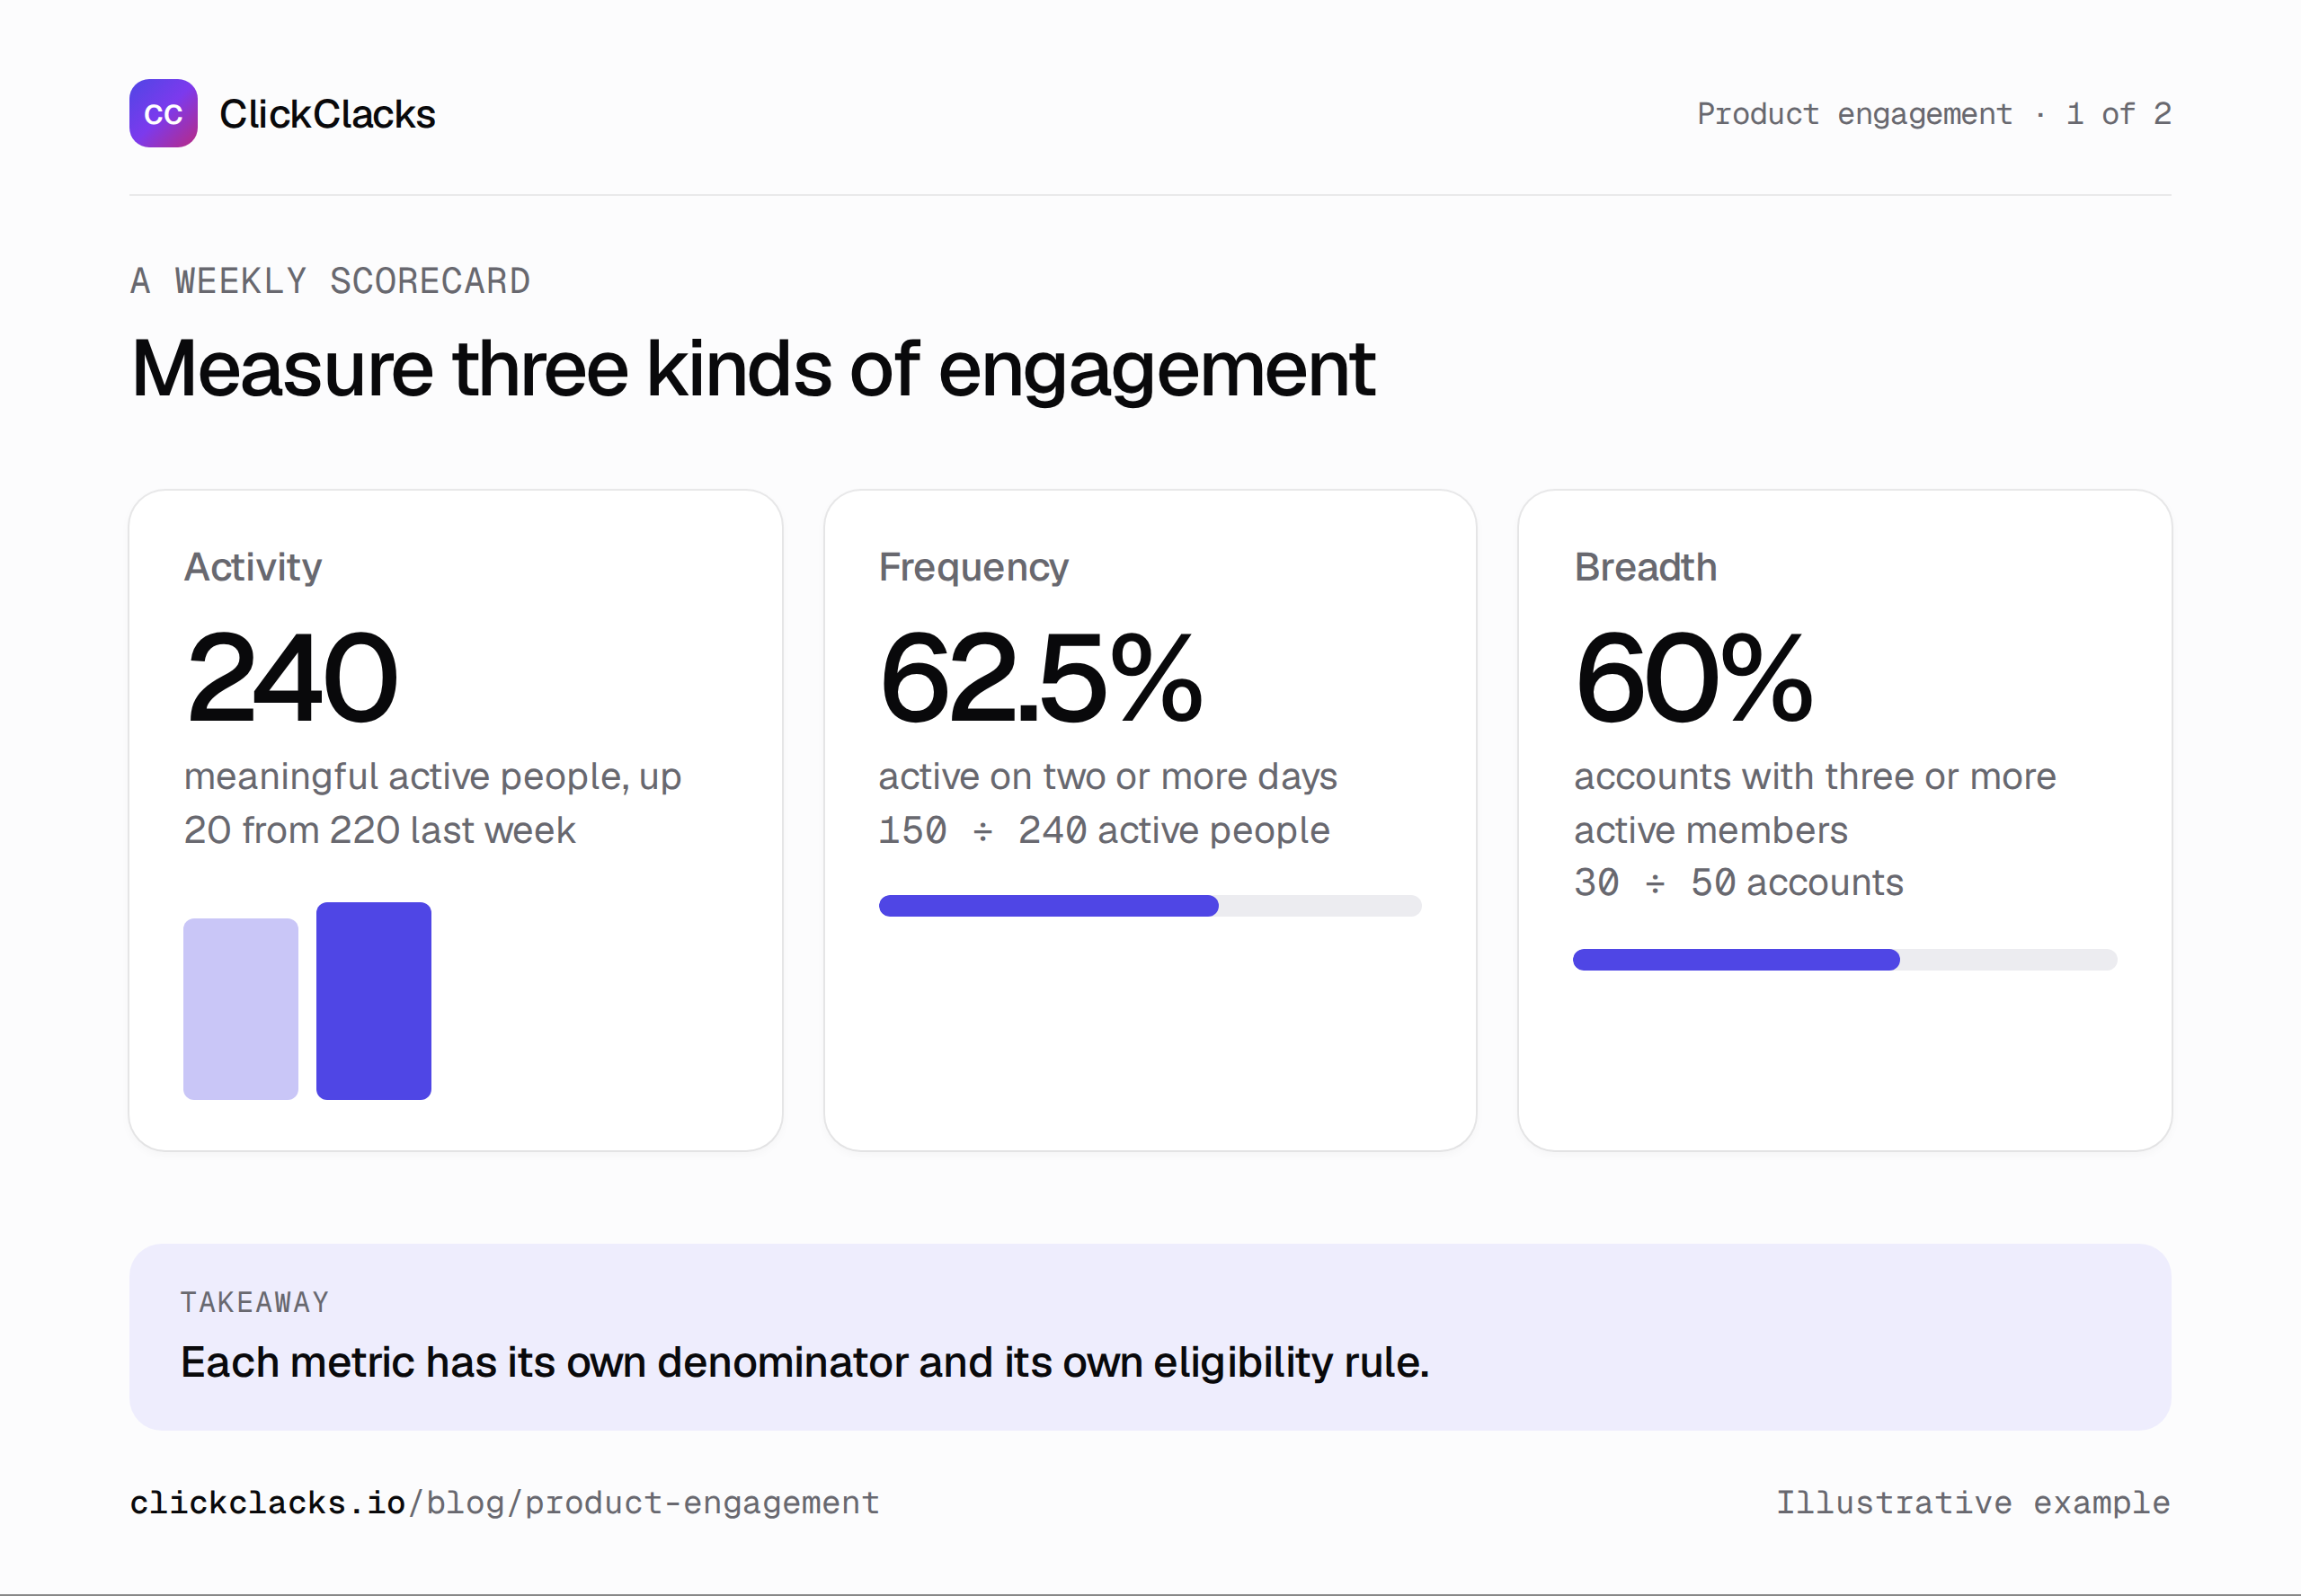
Each metric carries its own population and definition. They are not parts of one total.
Measure breadth when the product is collaborative
For the planning app, define broad account participation as at least three distinct members completing tasks during the week. Suppose 30 of 50 eligible team accounts meet that rule, giving a 60% participation rate.
Only include accounts for which three participating members is a reasonable expectation. A two-person workspace cannot qualify. Fix the eligibility rule before reviewing the result, and show excluded account counts separately if they matter to the business.
Breadth can also mean use across workflows, but counting more features is not automatically better. A focused user who reliably completes one important job may be successful. Choose a breadth measure only when multiple contributors or workflows are part of the product’s intended value.
Keep quality beside activity
More task-completion events could mean more useful work, or it could reflect duplicate events, trivial task creation, or changes in how the product models work. Choose a guardrail that can reveal a worse experience, such as failed completion attempts or repeated reopening caused by errors.
Task success is a useful concept because it ties measurement to whether an intended action was completed; this task-success reference provides background. Your production event still needs a precise definition and validation before it can represent that outcome reliably.
Avoid treating session duration as a default quality measure. A longer visit can reflect deep work, but it can also reflect waiting or confusion. Interpret it in the context of the task rather than adding it to an engagement score with an arbitrary positive weight.
Use comparable periods and stable definitions
Compare two complete weeks with the same timezone and exclusions. Note holidays, outages, instrumentation changes, and major releases. A current week that is only three days old should not be presented as a comparable decline against seven full days.
Preserve the distinction between calendar weeks and rolling seven-day windows. Rolling windows can smooth a daily view, but adjacent windows overlap heavily. A sequence of similar rolling numbers is not a sequence of independent observations.
If the meaningful activity definition changes, version it. Counting task creation instead of completion can legitimately answer a different question, but it creates a break in the series. Do not quietly replace the event and keep the old chart title.
Run the review in a consistent sequence
Start with measurement health. Are the data complete, are identities stable, and did an event change? Then inspect the main movement and its components. Only after that should the team propose a cause.
For the increase from 220 to 240 active people, ask whether it came from new sign-ups, continuing users, or returning users. If broad account participation stayed flat, a rise in individual activity might be concentrated in already engaged teams. That suggests a different investigation from a broad improvement across accounts.
Write the observation and hypothesis separately. “Twenty more people completed tasks” is an observation. “The new reminder caused the increase” is a hypothesis until the evaluation can distinguish it from other explanations.
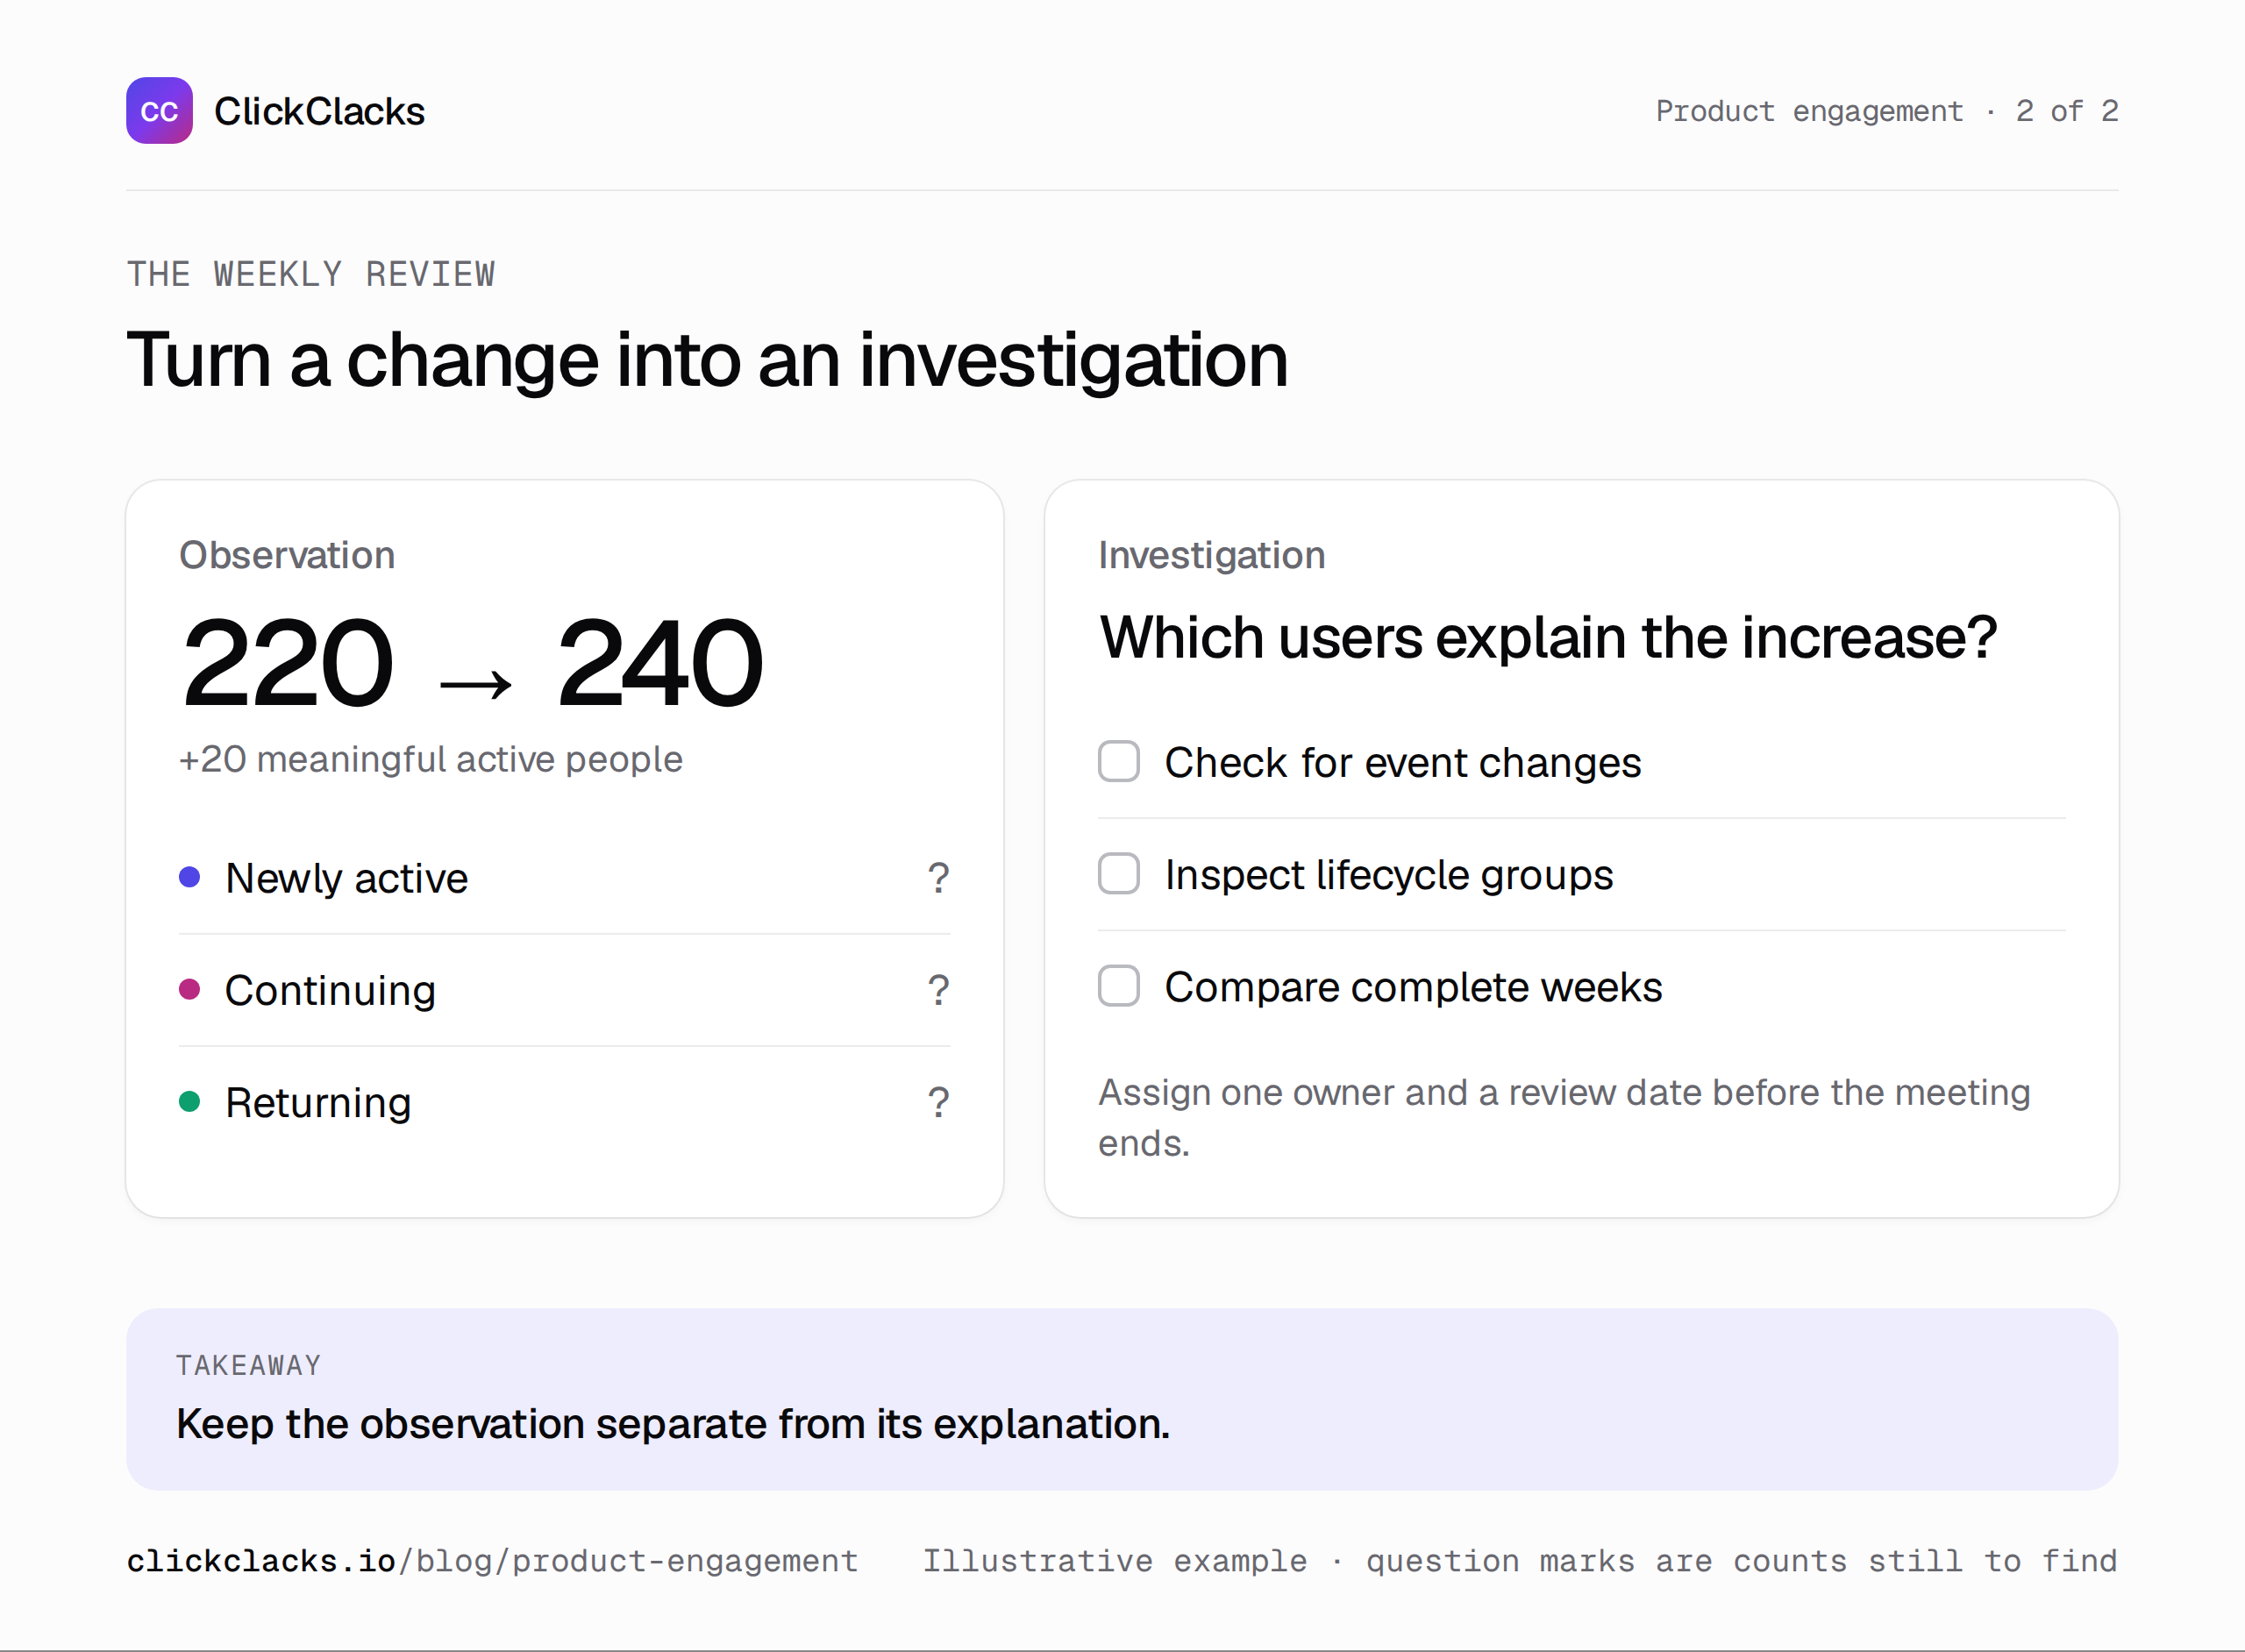
The meeting should produce a question someone can investigate, not a list of unsupported explanations.
Keep the dashboard small enough to explain
For this example, the core review needs meaningful weekly active people, the two-day share, broad account participation, and a quality guardrail. Add a cohort return measure when the question concerns whether new users keep using the product. Keep supporting breakdowns available without making them all headline metrics.
Give every view a short definition and a link to its underlying report. Boards can bring product reports together, but the board’s usefulness depends on choosing questions that belong in the same review. A visually tidy collection of unrelated charts still leaves the interpretation to the reader.
If a metric repeatedly produces no decision, remove it from the main view. It can remain available for a specific investigation. Retiring a distracting metric is part of maintaining the review, not a failure to be data-driven.
End with an accountable next step
A useful action might be: “Investigate why newly eligible team accounts rarely reach three active members; inspect invitation acceptance and first-task completion, then return next Tuesday.” It names a group, a question, and the evidence needed.
Record the owner and the date, then revisit the result before adding another investigation. If the issue turns out to be an eligibility mistake, repair the definition and annotate the affected period. If it is a product obstacle, design a change and decide how you will evaluate it.
The weekly scorecard has done its job when it helps the team move from observed behavior to a better-informed action. It does not need a composite engagement score or a perfect upward trend to be useful.
Keep reading
All posts
Analytics6 min read
Time to value: measure the wait for a useful result
Define time to value, keep non-completers visible, and break the wait into actionable stages. Learn why a faster median can coexist with a worse completion rate.
Analytics6 min read
Activation rate: choose the milestone before the metric
Define a meaningful activation milestone, calculate a cohort rate, and handle incomplete observation windows with practical examples for a SaaS product team.
Analytics6 min read
Customer retention metrics: separate users, accounts, and revenue
Separate user activity, account retention, and recurring revenue with worked examples. Calculate gross and net retention while keeping new-customer revenue out.