Conversion funnel optimization for a SaaS sign-up flow
Find and validate a SaaS sign-up obstacle, calculate step losses, estimate a change transparently, and evaluate the result with a useful downstream guardrail.
The ClickClacks team · 6 min read
On this page 8 sections
Conversion funnel optimization is the process of finding a measurable obstacle between someone starting a task and completing it, changing the experience, and checking whether the outcome improves. For a SaaS sign-up flow, that outcome should extend beyond an account record if the product promises something more useful.
Start by counting the same eligible people through a defined sequence. Check the tracking, compare losses between steps, and investigate the largest actionable gap. Then change one thing for a reason you can test. A shorter form is not automatically better if it brings more people into an experience they cannot use.
The walkthrough below uses fictional counts for a self-serve product. They illustrate the method and do not describe ClickClacks sign-ups, customers, or performance.
Write down the conversion you want
Suppose the job is creating a first usable workspace. The sequence is: start sign-up, create an account, verify the email address, create a workspace, and complete the first core task. Each person gets seven days from sign-up start to complete the sequence.
Decide whether intermediate actions may occur between required steps. Someone opening help before verifying an email should not fail an ordered funnel just because the journey was not consecutive. Different funnel modes answer different questions, as this funnel computation reference explains.
Choose the unit and exclusions before calculating. For this example, count distinct people, exclude documented internal tests, and allow only their first eligible entry during the cohort period. Do not mix session counts at the beginning with account counts at the end.
Calculate both step rates and absolute losses
Imagine 1,000 people start sign-up. Of them, 700 create an account, 420 verify email, 378 create a workspace, and 189 complete the first core task within seven days. Overall conversion is 189 divided by 1,000, or 18.9%.
Account creation converts 70% of entrants and loses 300 people. Email verification converts 60% of account creators and loses 280. Workspace creation converts 90% of verified people and loses 42. The first core task converts 50% of workspace creators and loses 189.
The last step has the lowest step rate, but the first step has the largest absolute loss. Neither fact automatically decides the priority. You also need to consider whether the obstacle is understood, whether the lost entrants wanted the product, and how feasible a useful change would be.
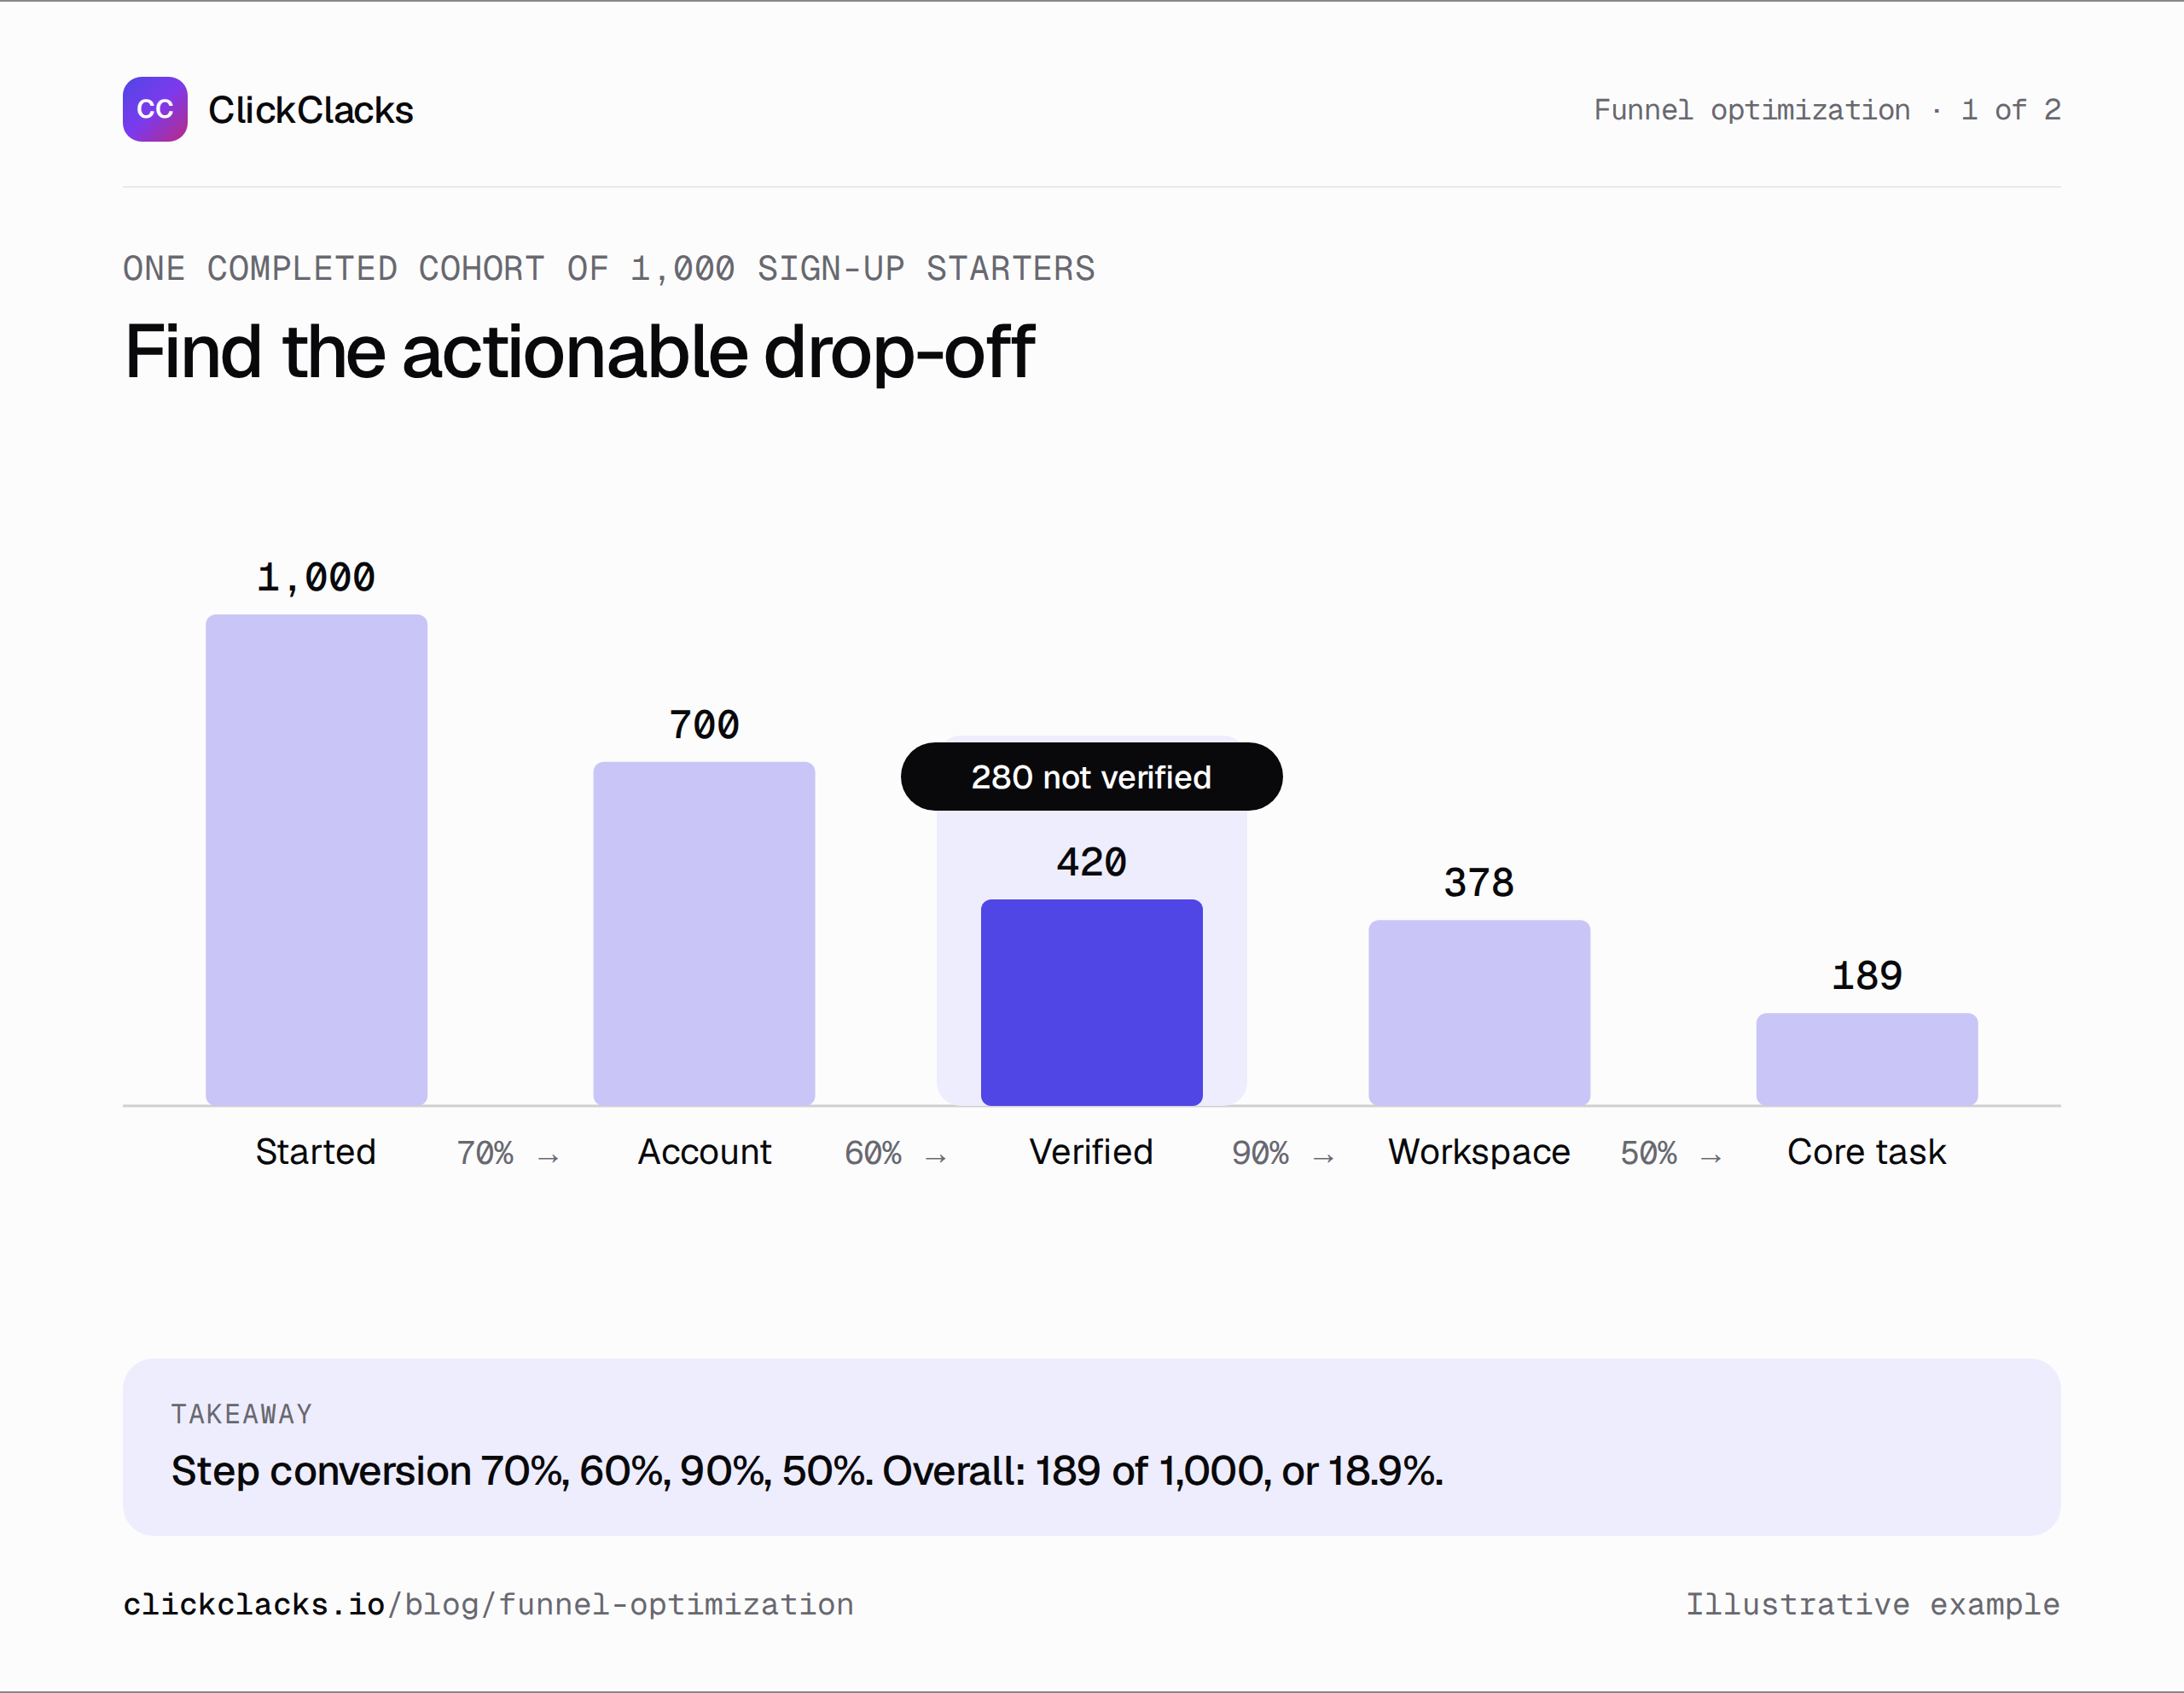
Counts are distinct people from one completed cohort, with seven days to convert.
Make sure the drop-off exists outside the chart
Take a few authorized test records through each transition. Verify that successful account creation and email verification are recorded after the relevant operation succeeds. A button-click event may count an attempt that fails validation or never reaches the server.
Check identity across the email link. If a user opens it on another device and the analytics system treats them as unrelated, the report may show an abandoned sign-up followed by a mysterious new user. Investigate how your implementation connects known account identity; do not join arbitrary visitors by weak clues.
Also inspect time and event retries. A verification arriving after seven days should fail this seven-day definition even if it ultimately succeeds. Repeated verification events should not increase the distinct-user count. These checks establish that the report represents the sequence you intended.
Separate loss from opportunity
For email verification, inspect delivery failures, expired links, repeated resend requests, and successful verification after a long delay. The same missing transition can have several causes. A deliverability problem needs a different fix from a confusing success screen.
For account creation, compare validation errors with deliberate exits. A required field that rejects valid input is actionable. Visitors who opened the form to inspect the product and chose not to continue may not be recoverable with a cosmetic change.
Avoid assuming all lost people would complete the rest of the funnel if you fixed one step. To estimate an opportunity, state the downstream assumption. Treat the calculation as a planning scenario, not a forecast or promised lift.
Estimate a small change transparently
Suppose a scenario improves verification from 60% to 70% among the same 700 account creators. That would produce 490 verified people, 70 more than the observed 420. If workspace creation stays at 90% and core-task completion stays at 50%, the scenario yields 220.5 expected completions, about 32 more than 189.
The fractional result is an expected value in a calculation, not half a person in a dataset. Round it only for planning language, and retain the assumptions. The newly recovered users may behave differently from the original converters, so downstream rates may not stay constant.
This kind of calculation helps compare effort with a plausible scale of benefit. It does not establish that verification can actually reach 70%, or that the proposed design will cause that change.
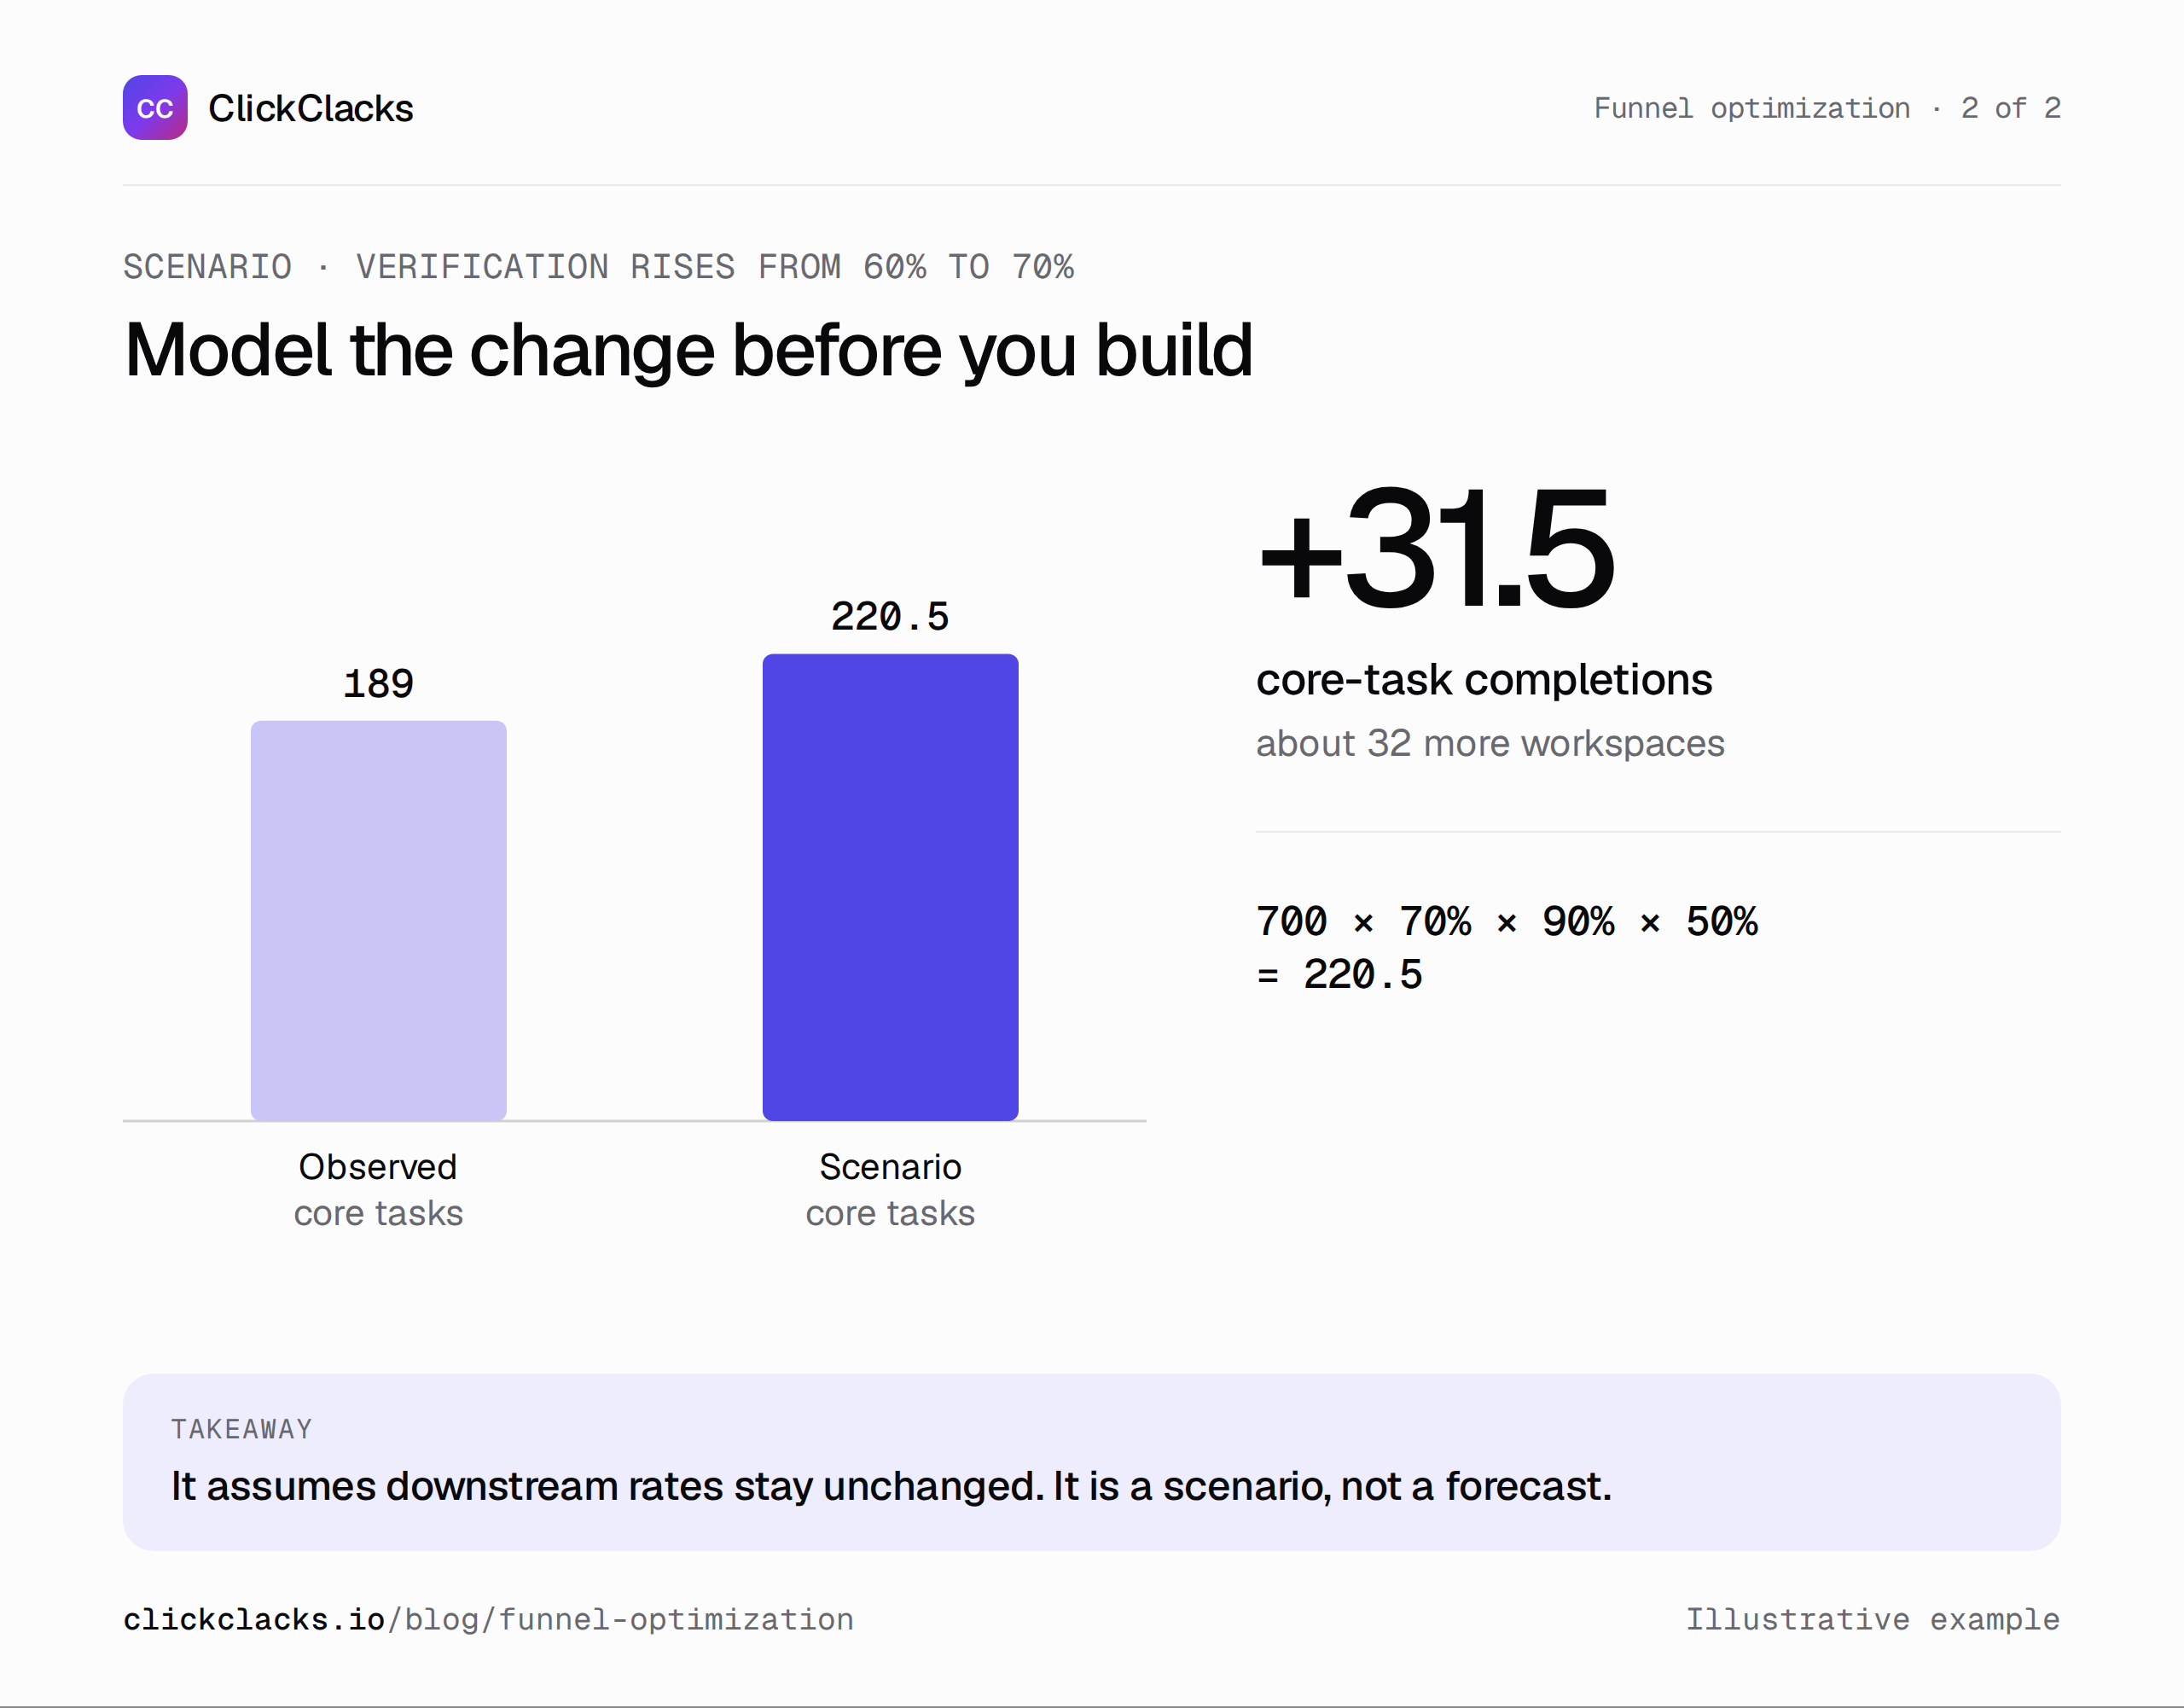
Planning scenario, not a forecast: 700 × 70% × 90% × 50% ≈ 221 completions.
Write a hypothesis narrow enough to test
A useful hypothesis identifies the problem, the change, and the expected transition. For example: “People cannot tell whether the verification email was sent. Showing the destination address and a clear resend state will increase successful verification within seven days.”
Do not combine that with a new pricing page, a shorter form, and a redesigned workspace screen if you need to understand which change mattered. Keep the experience coherent, but avoid creating an evaluation that cannot answer its own question.
Choose guardrails before release. In this example, monitor delivery failures, repeated resend volume, duplicate accounts, and later core-task completion. A rise in verification that comes with worse downstream use should prompt investigation rather than an automatic victory announcement.
Match the evidence to the conclusion
If you can run a randomized experiment, choose a stable assignment unit and check that the same person or account does not switch variants across visits. Decide the primary metric, observation window, minimum evidence requirements, and stopping rule before interpreting results.
Your experiment analysis method must match those decisions. Repeatedly checking a fixed-horizon test and stopping at a favorable result changes the error behavior. If you use a sequential method, understand its assumptions rather than treating the word “sequential” as permission to ignore study design.
For a small product without enough traffic for a useful experiment, a careful staged rollout and before-and-after review can still teach you something. Label the result observational. Check channel mix, seasonality, instrumentation releases, and cohort maturity before attributing the movement to your change.
Keep an optimization log
Record the original definition, baseline counts, investigated cause, proposed change, release date, and review result. Include decisions to do nothing. A suspected drop-off that turns out to be an identity bug is valuable knowledge, even though it does not produce an exciting redesign.
Use funnel analysis to keep the sequence visible, with the same definition across reviews. When comparing releases, annotate any event or population changes so a new chart is not silently presented as a continuation of the old one.
The next useful action is usually smaller than “optimize onboarding.” It is repairing a broken verification transition, clarifying one requirement, or testing a specific recovery path. A well-defined funnel makes that action measurable and gives the team a way to learn from the result.
Keep reading
All posts
Guides10 min read
User onboarding analytics: find where new users get stuck
Find the onboarding step that prevents activation, reproduce a worked funnel with sample events, and separate pending users from real drop-offs.
Guides6 min read
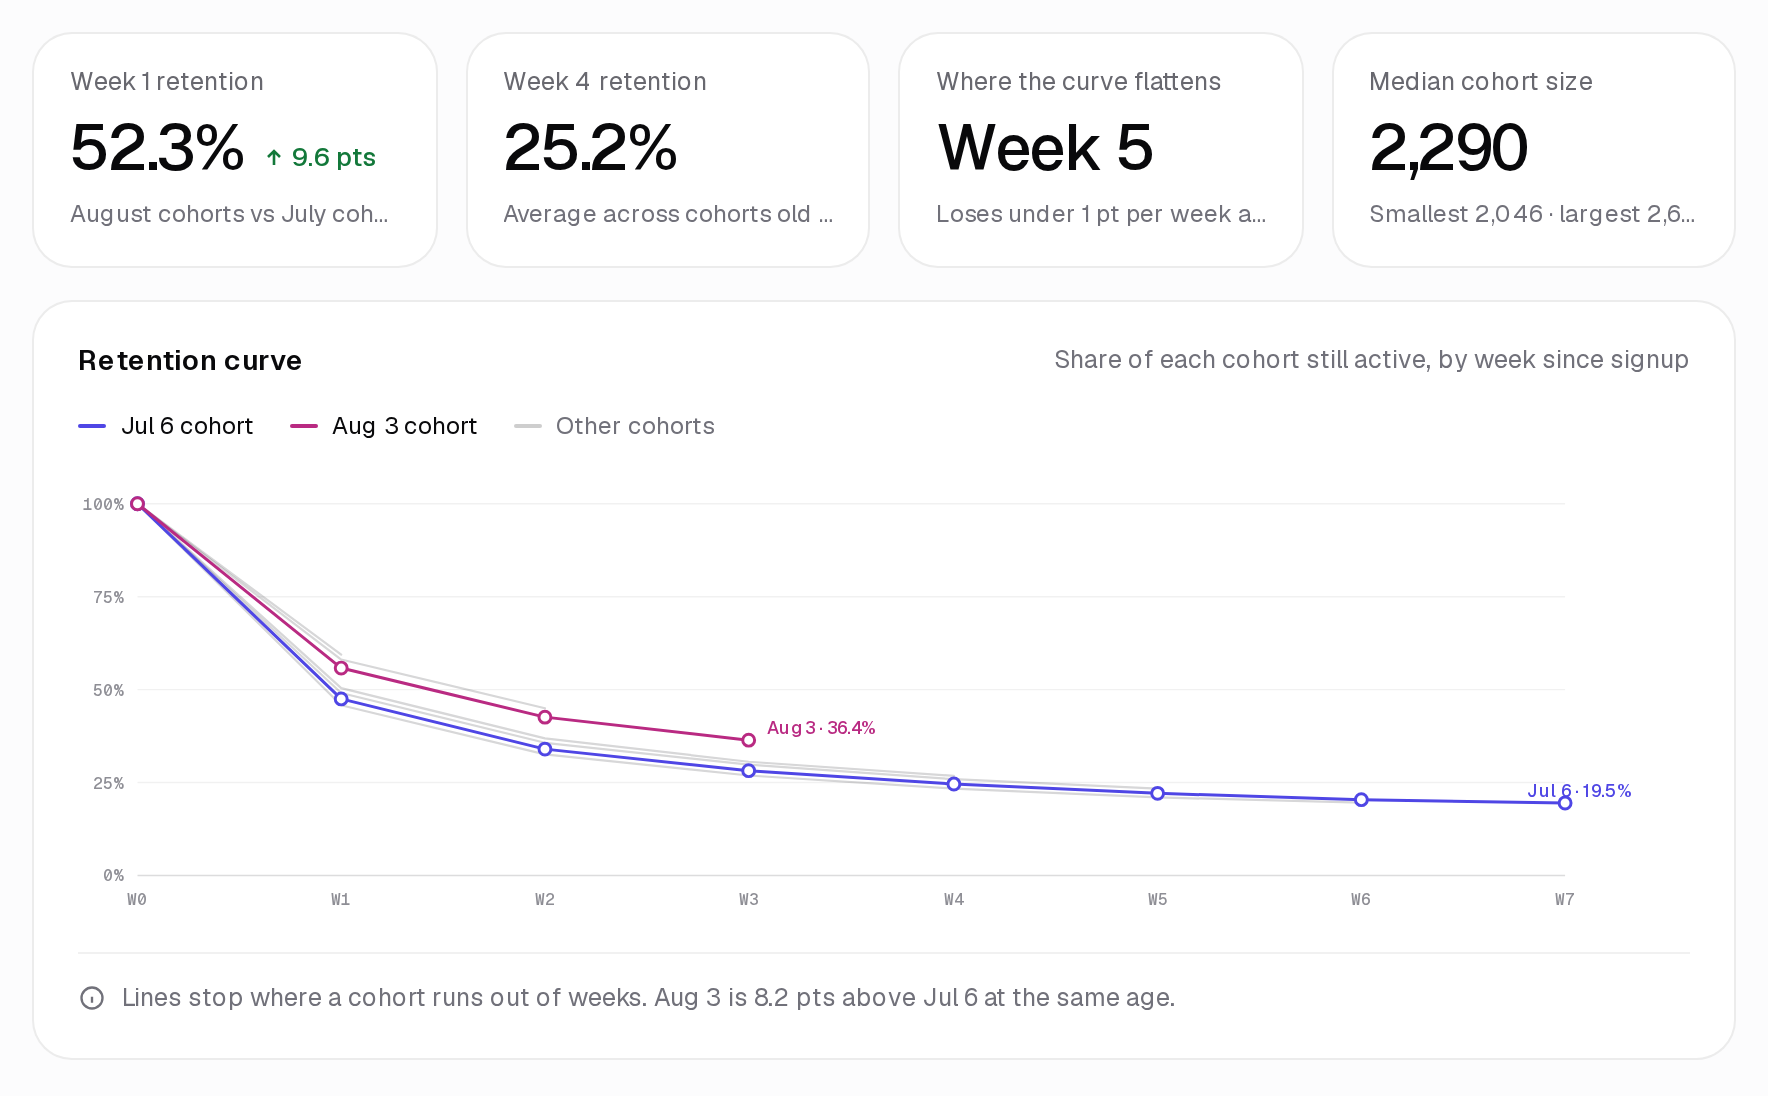
How to interpret cohort analysis without misreading the grid
Learn how to read cohort rows and columns, distinguish pending periods from zero activity, and compare retention fairly using an annotated worked example.
Guides6 min read
A client reporting template that explains what to do next
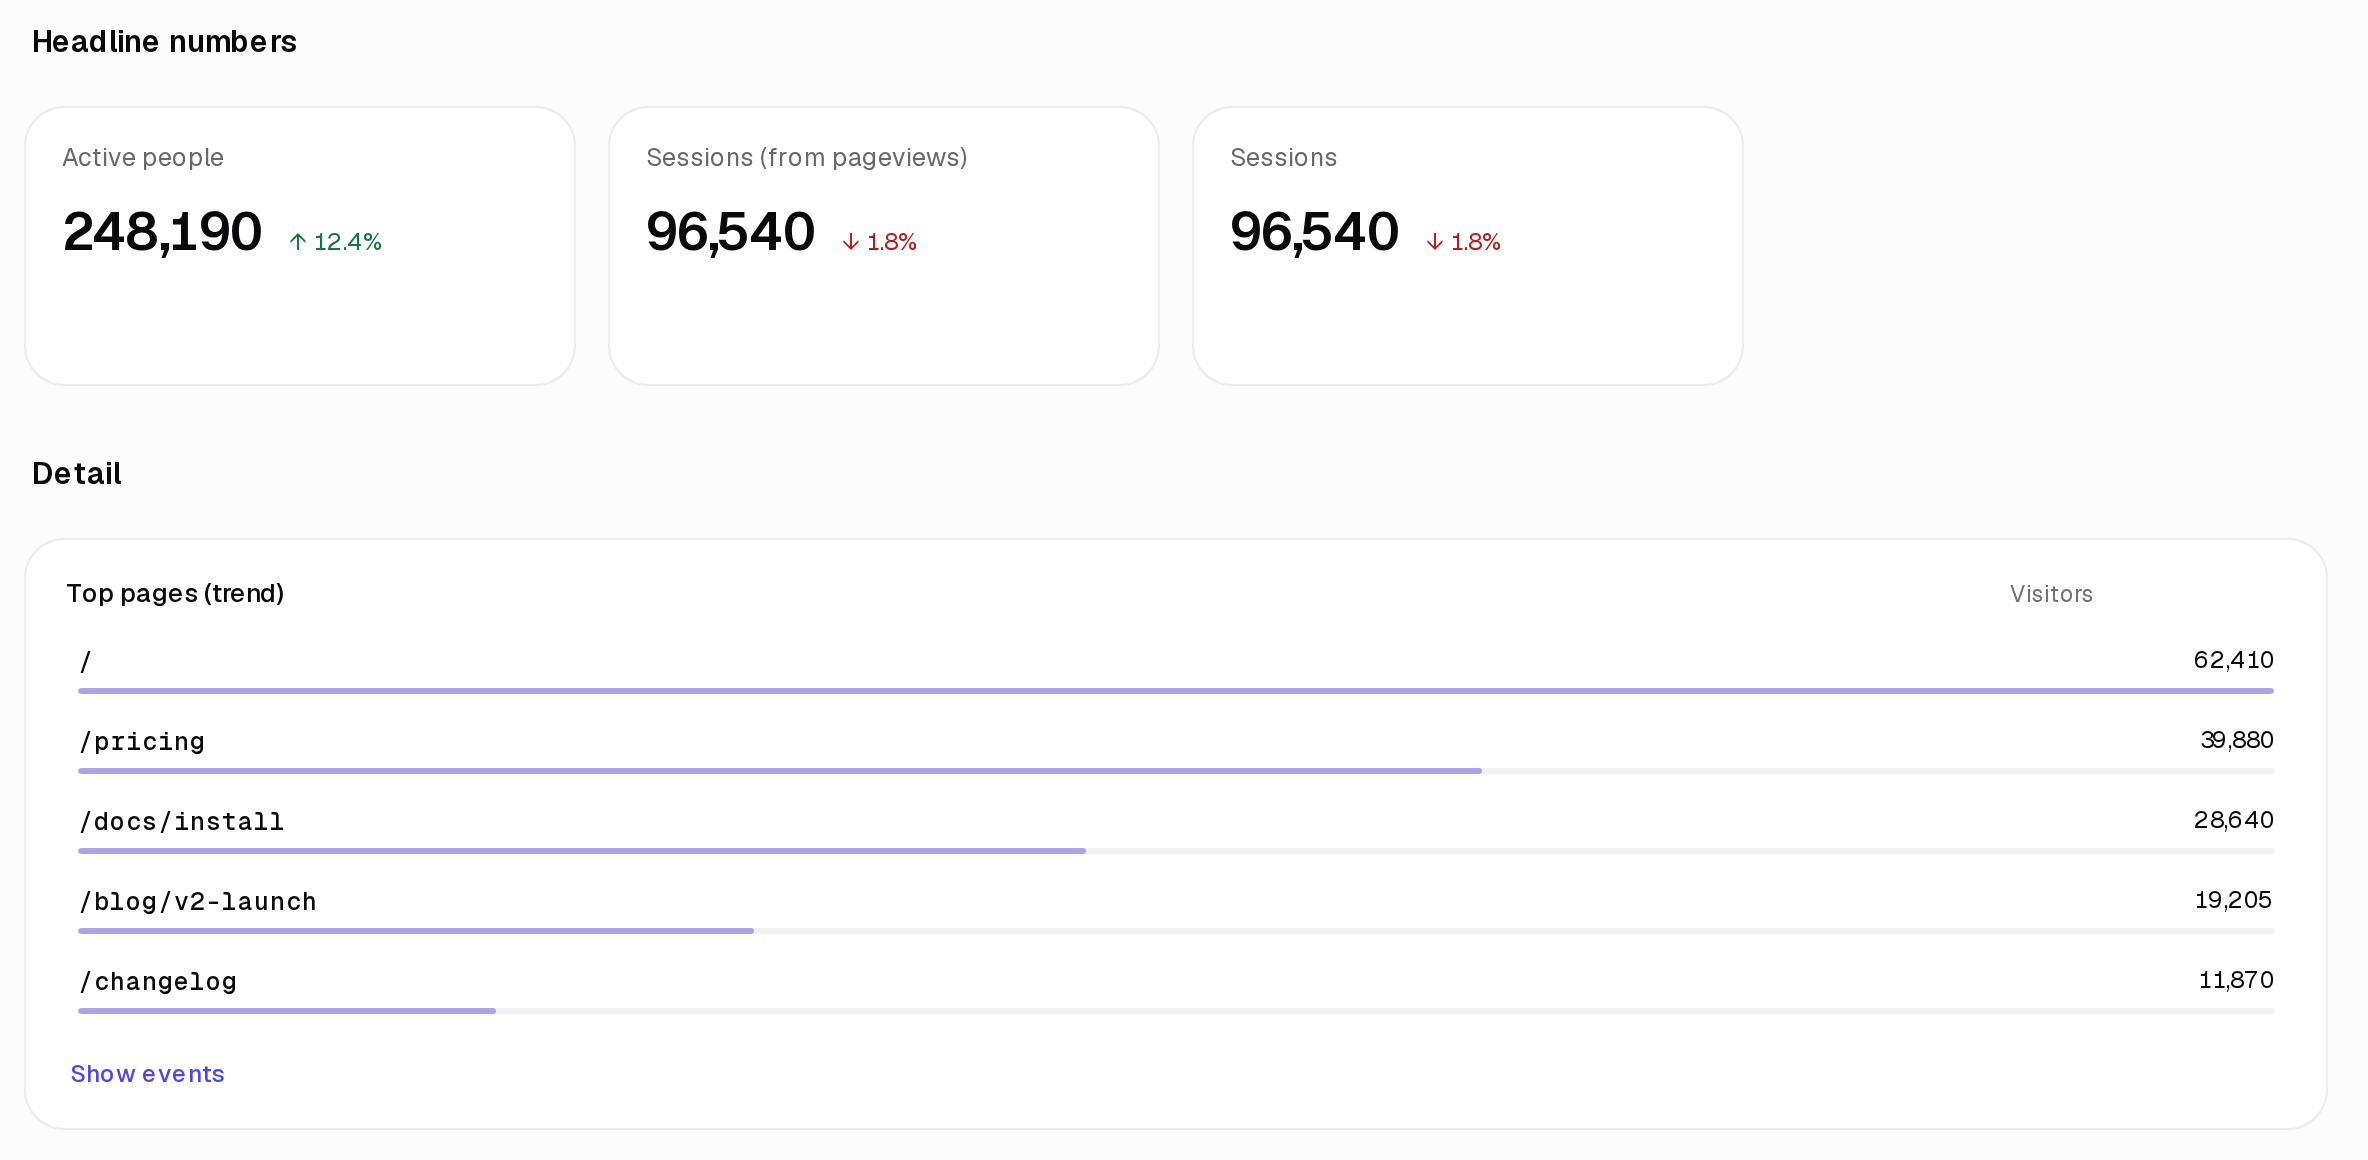
Copy a practical client reporting template with comparable results, clear limitations, and an owned next action. Includes an illustrative conversion-rate example.